I've done some research lately regarding ohlc ratio's. I wouldn't call them statistics because I'm not qualified. Anyway, I've found that on average and all "timeframes" the ratio of an average candle is 2 wicks, both of around 25%, so the body being near 50%. One of the thoughts that I have was to wait for price to move 25% of the range in one direction, wait till price reverses and then trade the open. Problem is that it's on average and the average human being has 1 tit and 1 ball.
Ignored
Definitely on the right track. From your data how you see it you also can see that if price has travelled more than 25pct of the average range away from the open and you're looking to trade from the extreme that it's probably gone too far for it to cross back across the open and go the other way. That's not to say it can't go significantly in that direction, just that it's unlikely to go that far this week.
Use that data but don't just think in terms of the bar looked at from the outside. Before a wick can be created a body must be.
Also Don't just look at on average, look at the distribution of the wick and body ranges I.E out of the last 500 weeks (say), for both red and green candles, what's the percentages bodies making 50-75. 75-100......200-225. Likewise for the wicks.
this friggin iPad takes you to the top on here when you hit return. A right pita.
Once you've got the percentages you'll be able to see an edge.it depends on which currency you look at as to the ranges.
Following your thinking, if price travels from the open, travels back to the open, forming a wick, if that wick is less than x range you have a definable edge w.r.t a body of y size forming in the opposite direction.
You can also look at how far price might need to move from the open before you do anything, this can help you stop getting whipped to death in ranging weeks. A 25-30 pip either way 'exclusion zone' around the open on GU is a good starting point. I'm not going to give the numbers away.
why the weekly?
1. For me price has to have enough potential range (price requires time to move) for costs to tend towards zero. I.e the cost of spreads and commissions becomes insignificant in comparison to the ranges we're trading.
2. The weekly is the real market open and close. Brokers even use different times for the daily, never mind h4. Yes brokers can't agree on the Sunday bar but in terms of the range the difference becomes less significant.
3. By using the weekly you're automatically limiting the amount you trade, which is a GOOD THING. Do it right and after 12 months, even if you're terrible at guessing, you will not have gone bust like most retailers do. If you lose on Thursday for instance you're not going to enter on Friday. why? Because price requires time to move and there's no time left.
4. You do not hold over the weekend, ever. If you need this explaining you shouldn't be trading a live account yet.
5. Why 6 hour bars? I'm a human being. I eat, sleep, work 12 hours a day, and have a family. Even trading fictitious 4 hour bars is impossible. You want freedom in your life and you want to accomplish this by trading and. You do this by tying yourself to a trading screen. Can you see that this is nonesensical?
6. Anyway, why six hours? One it's convenient, two 6 hours divides exactly into the daily. This bleeding iPad, I give up.
I went to the chart and was just going to say wrt anus' observation. If a candle moves 25% one way then crosses back over, it is most likely not going back. And if it reaches a certain limit such as 300 pips from open to high or low it will retrace 25% from that high or low to the close.
ai . Even if it does go back, if you've run the stats you should know the edge. Adding to your edge is your time management. I.e. It's gone back, it's Friday afternoon, you're not getting back into the black this week. You close for a loss which is excellent, you've just cut a loss before your stop got hit. Plenty more fish in the sea.
don't think there's anything magical about 6 hours either, they're total bullsh1t, just a made up tool. 6 is a good fit for my hours, the ranges seem to help and it divides nicely into to the day. Anything beyond that...just don't read anything in to it.
I went to the chart and was just going to say wrt anus' observation. If a candle moves 25% one way then crosses back over, it is most likely not going back. And if it reaches a certain limit such as 300 pips from open to high or low it will retrace 25% from that high or low to the close.
Ignored
Good morning, can you explian this point of yours with an image when you have time please?
{quote} Definitely on the right track. From your data how you see it you also can see that if price has travelled more than 25pct of the average range away from the open and you're looking to trade from the extreme that it's probably gone too far for it to cross back across the open and go the other way. That's not to say it can't go significantly in that direction, just that it's unlikely to go that far this week. Use that data but don't just think in terms of the bar looked at from the outside. Before a wick can be created a body must be. Also...
Ignored
I tried to do the distribution in openoffice calc but I couldn't get i done. I know TRO has a distribution indy, but I can't find it anywhere...
yeah he does, it's not one of the free ones unfortunately. Look up a guy called 'relativity' he put some tools out that are useful.
You're not looking for a shoo win. But what can be found something that is a number of percent more likely than something else
talking of tro and his 20 pip daily wick thing. There is validity to it, but his Presentation of it is deliberately obfuscated, probably just to get you to buy, sorry 'donate' for his indies. Trade in one direction only is valid enough, trade within 20 pips of the low is valid enough: he's seen the % likelihood of a wick 20 pips or less as against the % likely hood of a body 40 pips or more, and the likelihood of a body larger than a wick is good. What he never mentions us the relation to the open and how far it's gone and how long to hold for, leaving folks scratching their heads trying to catch falling knives and risking 10-20 pips to catch 3 on the retracement from the extreme trade.
{quote} Finally you are spilling it out, what took you so long bro. Please continue.
Ignored
I will say this. It is important that we think for ourselves and make our own discoveries as this will give us confidence to trade. Keep on asking yourself, how you can find answers to important questions about price movement.
Here is my kind of thinking when looking at OHLC data. Say if I was to just go long on candle open (not suggesting you trade like this). At what point would I know that I am probably trading in the wrong direction of the candle/market and get out? Is it possible to learn this from OHLC data? Short side and long side of candle? Frequency distribution tables is a good way. Is such knowledge enough to trade successfully in itself? What do you learn from it that you can apply to other things that you have learned/discovered? For example does price movement care about what time it started? So why limit yourselves to apply what you learn to just one reference point. I mean, could the same not be applied to an hourly candle starting and ending at 1 minute past the hour?
Keep on asking and finding answers to questions and it will be interesting what you will discover that will help you in your trading. Sometimes it ends in a dead end but that does not necessarily mean it was a waste of time.
Regards
Neio
BTW, Relativity's thread was also an excellent way of learning and trying to make sense of how price moves in order to profit. All can be added to previous discoveries.
An expert is a man who has made all the mistakes which can be made
{quote} I will say this. It is important that we think for ourselves and make our own discoveries as this will give us confidence to trade. Keep on asking yourself, how you can find answers to important questions about price movement. Here is my kind of thinking when looking at OHLC data. Say if I was to just go long on candle open (not suggesting you trade like this). At what point would I know that I am probably trading in the wrong direction of the candle/market and get out? Is it possible to learn this from OHLC data? Short side and long side...
Ignored
Thanks for your kind response, I have been following your thread and post for some time now and it is very educative. I also agree with your first line. I will look up relativity thread.
In the context of this method are we observing the weekly open then making decisions based on the h6 candle in relation to the open and time of week? Does this involve bracketing the open and setting pending orders or if we see candles turning ie. engulfing we are looking to follow along?
why the weekly? 1. For me price has to have enough potential range (price requires time to move) for costs to tend towards zero. I.e the cost of spreads and commissions becomes insignificant in comparison to the ranges we're trading. 2. The weekly is the real market open and close. Brokers even use different times for the daily, never mind h4. Yes brokers can't agree on the Sunday bar but in terms of the range the difference becomes less significant. 3. By using the weekly you're automatically limiting the amount you trade, which is a GOOD THING....
Ignored
Yes, iTarding can be frustrating sometimes....
Have to say I am finding this thread and other stuff you have posted extremely interesting and thought provoking. Thanks for taking the time to share, much appreciated. Always like people who challenge the accepted "norms", whatever the subject area. But to understand things in any discipline you need a certain level or threshold in accumulated/accrued knowledge, let alone to have the confidence to question things and tackle them head on. You have obviously gone through a long journey to get where you are now with your trading and I respect that.
|
Membership Revoked
|
Joined Nov 2010
|3,324 Posts
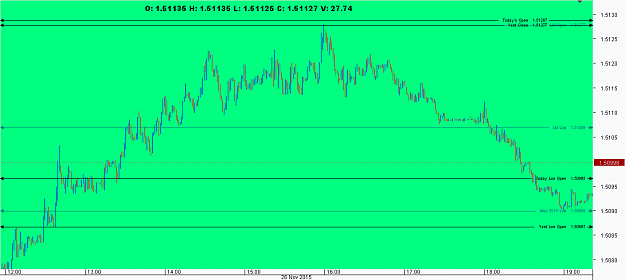
Hi Nunrguy, the catchy thread title caught my eye, anything with added BS has to be worth a look. Haven't read entire thread but get the gist of what you driving at. The references to OHLC sparked interest. Maybe there is nothing more required other than OHLC ? When all is said and done the only records we have of the market are time stamped OHLC from Yearly to 1min. The further down the timescale, the lower they become in the pecking order. What if a Monthly High from 1999 or a weekly open from January for example could be recycled and repeatedly used over and over ? OHLC are the only points of reference that exist and they can be recycled over and over. Here is a 1min GU chart which shows some reference points. Now obviously not pushing as some bullshit Holy Grail scenario but with a good command of PA these levels can be used repeatedly for very low risk trades. Anyway will leave it there as not sure if this OHLC analysis fits in with your aims here. Good Luck.
Attached Image (click to enlarge)
Once You See, You Can't Unsee But You Will Get The Odd Poke In The Eye
{quote} Yes, iTarding can be frustrating sometimes.... Have to say I am finding this thread and other stuff you have posted extremely interesting and thought provoking. Thanks for taking the time to share, much appreciated. Always like people who challenge the accepted "norms", whatever the subject area. But to understand things in any discipline you need a certain level or threshold in accumulated/accrued knowledge, let alone to have the confidence to question things and tackle them head on. You have obviously gone through a long journey to get...
Hi Nunrguy, the catchy thread title caught my eye, anything with added BS has to be worth a look. Haven't read entire thread but get the gist of what you driving at. The references to OHLC sparked interest. Maybe there is nothing more required other than OHLC ? When all is said and done the only records we have of the market are time stamped OHLC from Yearly to 1min. The further down the timescale, the lower they become in the pecking order. What if a Monthly High from 1999 or a weekly open from January for example could be recycled and repeatedly...
Ignored
You can draw a line anywhere you like on a chart. Price can bounce off it or it can go straight through it. Does the line have any significance apart from that which you put on it?
The weekly open is a fixed reference, relative to THIS week. Price can be moving away from it or moving towards it. If you don't have a fixed reference how can you ever know if price is up or down?