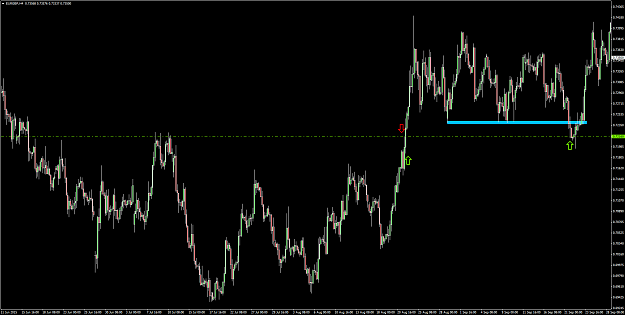
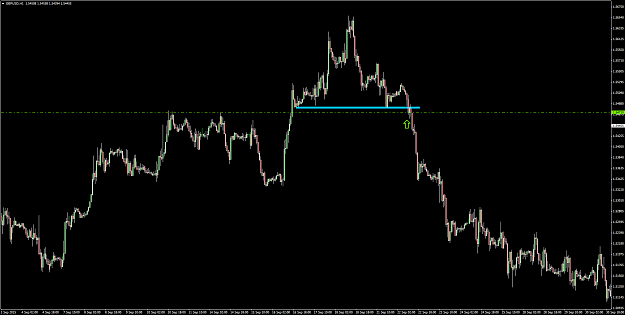
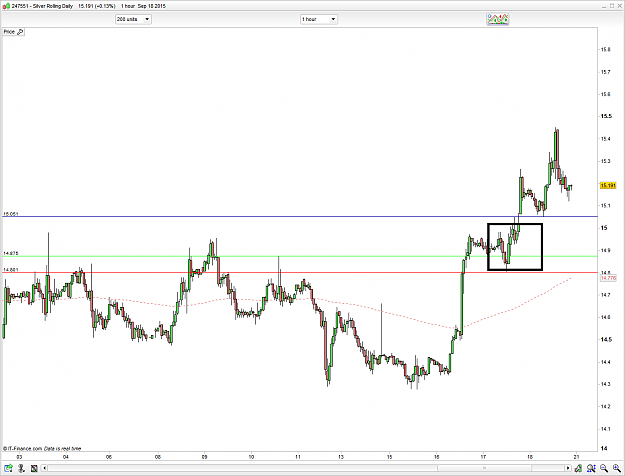
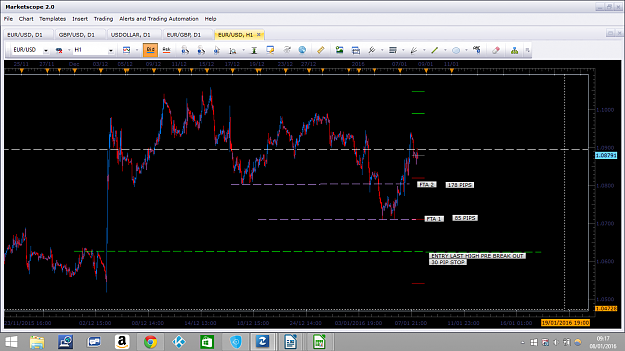
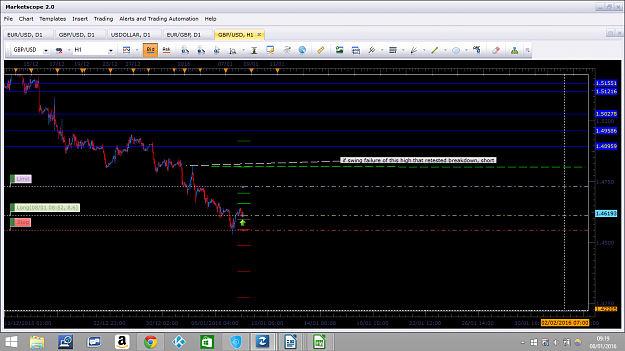
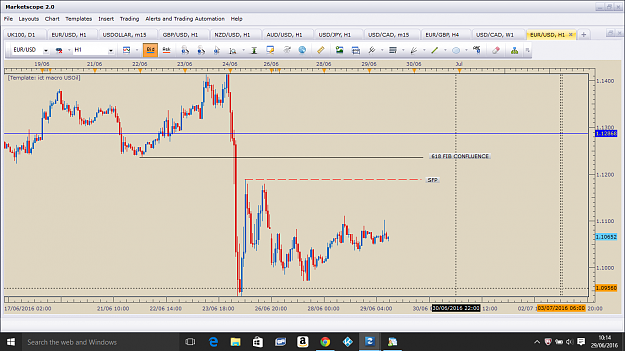
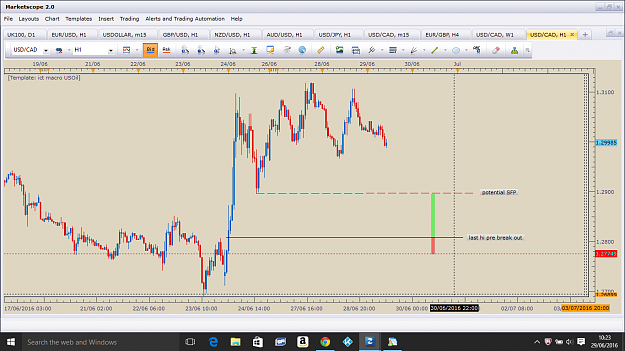
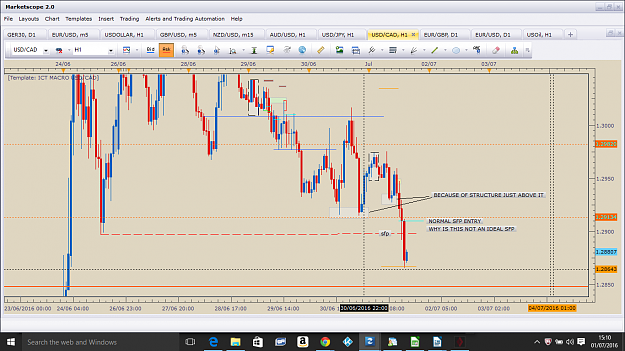
DislikedEvening Gents, Some set-ups from my Sunday analysis below, any comments or criticism welcome. (1) EUR/GBP - Buy @ 0.7224 (4 Hour Chart) Comment: Buy dip from bullish flag into resistance. Daily chart showing long bias. SL: 0.72 TP: 0.7266 and 0.7402 {image} (2) USD/JPY - Sell @ 120.4 (1 Hour Chart) Comment: Sell bounce from previous support. Daily chart showing short bias. SL: 120.5 TP: 120.11 {image} (3) GBP/USD - Buy @ 1.5471 (1 Hour Chart) Comment: Buy at previous resistance. SL: 1.5457 TP: 1.5521 {image} (4) Silver - Buy @ 14.875 (1 Hour Chart)...Ignored
I will give you some feedback on each of these charts but before I do, do you want to fill me on on whether you took the first four (I notice the last three haven't hit your engagement levels yet) and if so, what the result was?