• Home
  • Forums
  • Trades
  • News
  • Calendar
  • Market
  • Brokers
  • Login
  • Join
  • User/Email: Password:
  • 9:40am
Menu
  • Forums
  • Trades
  • News
  • Calendar
  • Market
  • Brokers
  • Login
  • Join
  • 9:40am
Sister Sites
  • Metals Mine
  • Energy EXCH
  • Crypto Craft

Options

Bookmark Thread

First Page First Unread Last Page Last Post

Print Thread

Similar Threads

A better Editor for mql is available. 100x better than MetaEditor 20 replies

Broker needs to do better, much better 4 replies

Better momentum and better Sine wave indicator 0 replies

Mathematical reasons why MOST DayTraders & scalpers fail? 197 replies

Is Better still better? 1 reply

  • Commercial Content
  • /
  • Reply to Thread
  • Subscribe
  • 2,918
Attachments: Fail Better
Exit Attachments

Fail Better

  • Last Post
  •  
  • Page 1 23456 305
  • Page 1 2 305
  •  
  • Post #1
  • Quote
  • First Post: Apr 7, 2011 10:50am Apr 7, 2011 10:50am
  •  the_wizard
  • | Commercial Member | Joined Jan 2007 | 1,442 Posts
I'd like to share the way I make money trading.

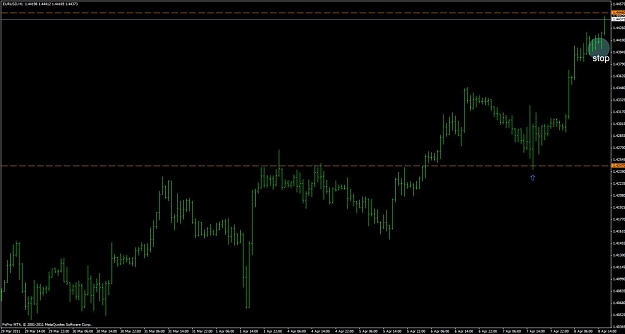
I'm a discretionary trader that primarily uses support and resistance to define my entries and exits.

Throughout this thread I will share the setups I trade, my thought processes and some insights into the behaviour of both the markets and the traders that operate in them.
Please note: I cannot respond to PM's but you can email me via my profile.
  • Post #2
  • Quote
  • Edited Apr 8, 2011 9:49am Apr 7, 2011 12:25pm | Edited Apr 8, 2011 9:49am
  •  the_wizard
  • | Commercial Member | Joined Jan 2007 | 1,442 Posts
If you are still are not making money trading it is because something you are doing has not been working. And if something isn't working, there's only one way to fix it for good. You need to take it completely apart and rebuild it piece by piece. Only once this is done can you make sure that every single element of your trading is working at its optimum level.

Some of you may know me from my contributions to the J16 thread. I have a lot to thank J16 for since it was reading his thread that got me profitable and I initially built my accounts using "price action" in the way he taught.

However, when I used my record to get a seat at a professional futures trading firm in London, I was fortunate enough to sit alongside some incredible traders. And the one thing I learnt at this point in my career was that one could enter at the source of a move with a high degree of probability.

The source of the move is the level price turns at. It is not 116 pips after it's hit the level and formed a pin which was where I was looking for my entries.

I was forced into exploring this further because we had no choice but to keep the risk management tight and being able to enter at the source became of the utmost importance.
Please note: I cannot respond to PM's but you can email me via my profile.
 
3
  • Post #3
  • Quote
  • Edited at 8:00pm Apr 7, 2011 1:05pm | Edited at 8:00pm
  •  the_wizard
  • | Commercial Member | Joined Jan 2007 | 1,442 Posts
Now that is not to say that trading candlesticks is not a viable strategy. I still use them (particularly on the daily time frame) to gauge potential market direction.

However, after discussions with other successful traders, I began to distrust them in terms of entries one side and stops the other.

Let's look at this in a little more detail.

A bullish pin, by way of example, simply shows that demand has come in at a level. However, the fact that buyers came in does NOT mean that buyers will continue bidding prices up. I started to think of a candlestick pattern in the same way I thought of an indicator: it lags.

If you think of the market moves as having a cause and effect relationship, the cause of a move is the market participants that interact at the areas of perceived value (or lack of it), the effect is the resulting candlestick.

Now I would sit there waiting for setups and I would say to the other traders: "I'm waiting for confirmation" but what I didn't realise is that by trading the effect and not the cause, you are always one step behind the market.

So, the aim became to pinpoint an entry at an area that will cause other traders to follow you which can then create the effect of favourable momentum, meaning that still more traders join later and the momentum continues.
Please note: I cannot respond to PM's but you can email me via my profile.
 
4
  • Post #4
  • Quote
  • Apr 7, 2011 1:09pm Apr 7, 2011 1:09pm
  •  Alexone
  • | Joined Jan 2010 | Status: Member | 1,012 Posts
Is this gonna be another thread where you post a couple of times and then abandon it? Because seems interesting so far...
 
 
  • Post #5
  • Quote
  • Edited at 8:17pm Apr 7, 2011 1:46pm | Edited at 8:17pm
  •  the_wizard
  • | Commercial Member | Joined Jan 2007 | 1,442 Posts
There are a few other important points to make about candlestick patterns.

Firstly, if price trades into a significant technical level, the probability shifts in favour of a reaction as the limit orders get hit from those traders entering and exiting the market. However, the duration of that reaction is unknown. Or to put it in laymans terms: it's one thing to accept that price will react to a key support level but it's another thing entirely when you have to work out how far it will travel in your favour. The simple fact is: if you enter at the source of the move rather than after the reaction, you have more options in the event there is no follow through from the other market participants.

This leads me onto my second point. The "entry" of the pin itself is usually at a random price. This then poses a problem for those traders that love to get their stops to "break even" because the majority of the time, their break even price means absolutely nothing to the market.

This loosely leads me onto my third point. Candlesticks have an open and a close. The forex market does not. All candlesticks do, is break the market movement down into convenient "slices" of time but it is important to realise that the market does not stop moving. This therefore means that a "setup" can be dependent on a completely arbitrary concept such as the time your broker considers to be the "close".

Perhaps worse than this, is the fact that you can miss a level that price has an extremely high probability of bouncing at simply because you failed to get a pretty candlestick that has just the right length wick and just the right size body to tuck it nicely within the previous candle within the window of time that you chose.

This last point requires time to digest.
Please note: I cannot respond to PM's but you can email me via my profile.
 
1
  • Post #6
  • Quote
  • Edited at 8:31pm Apr 7, 2011 8:18pm | Edited at 8:31pm
  •  the_wizard
  • | Commercial Member | Joined Jan 2007 | 1,442 Posts
Now I call myself a price action trader. But just not in the way everyone on forums these days seems to think of it.

I'm not too concerned what kind of candlestick price has formed but I am concerned with how price has moved and how price is moving.

I consider several things in my trading in order for me to make an informed decision. Here are some of the key elements:

The area of value or lack of (support/resistance)

- How price has reacted to this previously or how significant it is
- How price is reacting to it presently
- The velocity with which price approaches it
- How far price has moved on the day when it approaches it

Time

- The time of day when price encounters areas of value and the effect of that on liquidity

The market participants

- Where the weak hands are likely to be positioned
- What the strong hands have to do to shake the weak hands out

Market Sentiment

- The event risk each day in light of what traders are currently focusing on
Please note: I cannot respond to PM's but you can email me via my profile.
 
2
  • Post #7
  • Quote
  • Apr 7, 2011 9:45pm Apr 7, 2011 9:45pm
  •  the_wizard
  • | Commercial Member | Joined Jan 2007 | 1,442 Posts
Time for an example. This was the last trade I did in Forex (I trade multiple markets).

This is going to be quite hard to illustrate in static charts but I will give it a go.

USD/JPY traded into daily resistance on Friday (Non-Farms day). The fact that the market has not visited this area for a significant amount of time makes it an area of interest to me.

The actual resistance was marked on my chart as 84.39 as this was the mean point of the highs that made up the consolidation.

The mean is extremely effective in pinpointing areas. Far more so than the area with the most touches which is what many traders tend to look at.

Now the way in which price rallied into this area is what made it attractive.

Firstly price has exceeded its 20 period ATR on the daily chart .

Secondly price accelerated into resistance. This is key. As most of us should no doubt be aware by now, momentum does not necessarily indicate a force. But it does make it a hard trade to take psychologically. And the hardest trades to take are often the best ones.

Now I didn't get a fill at 84.39 which was fortuitous because there was only a minor reaction before price consolidated below the level and then went once again for the resistance. At this point, it becomes clear the the "market" is going to go for the swing point and take the stops and I'm going to get a better entry.

The fact that the strong hands in the market will attempt to push price here to take the weaker hands out is not groundbreaking stuff. This is all pretty simple stuff and not that clever. But then trading doesn't need to be.

I took an entry short at 84.51 (just beyond the swing high) with a target area of the circled highs. See chart 1 below.

It wasn't a perfect entry and I took a bit of heat but the trade made it to the target - the white dashed line in chart 2 which marks the swing high circled in the previous chart and the price at which I had my limit buy order.
Attached Images (click to enlarge)
Click to Enlarge

Name: usd_jpy.gif
Size: 18 KB Click to Enlarge

Name: usd_jpy_part2.gif
Size: 16 KB
Please note: I cannot respond to PM's but you can email me via my profile.
 
 
  • Post #8
  • Quote
  • Edited at 4:06am Apr 8, 2011 3:37am | Edited at 4:06am
  •  Chris_B
  • | Joined Jun 2009 | Status: Member | 702 Posts
Hi The Wizard...

I like trading like this...and I'm trying to get better...I will follow your journal!!


EDIT: where do you place your stoploss (if you place it) in the example above??
Market is like a puzzle, YOU have to fit the pieces!!
 
 
  • Post #9
  • Quote
  • Apr 8, 2011 6:18am Apr 8, 2011 6:18am
  •  the_wizard
  • | Commercial Member | Joined Jan 2007 | 1,442 Posts
The books and the forums and the coaches always go on about needing "discipline" and needing "patience". They're right.

What they don't often tell you is that you need a good memory.

Memory is so important to me in trading that I started referring to my technique as not fundamental analysis, not technical analysis but memory analysis.

You might be wondering what on earth I'm talking about so let me hand you over to Edwin Lefevre's famous "Reminscences of a Stock Operator":

Another lesson I learned early is that there is nothing new in Wall Street. There can't be because speculation is as old as the hills. Whatever happens in the stock market to-day has happened before and will happen again. I've never forgotten that. I suppose I really manage to remember when and how it happened. The fact that I remember that way is my way of capitalising experience.

I try and remember everything.

But memory is fallible. A trading record is not.

So, the easiest way to get good at trading it is by keeping a trading record.

Even Livermore kept one. He called it a "dope sheet" if my memory is any good ;-)

So record keeping...and this is where everyone starts skim reading because they've heard it all before. Don't. It's absolutely vital.

I cannot emphasise the importance of this enough and yet still, so few people do it.

Now those that do keep a record often only do so, so that they can tell you what their strike rate or their risk/reward ratio is. Or maybe what day of the week they do best. That's all very interesting (and relevant to your edge) but the most important element of record keeping, in my opinion, is analysing each trade after you have taken it and noting down whether there was a better entry and exit to be had.

This is how you learn to refine your technique.

The reason I called this thread "Fail Better" is because that is the hallmark of a good trader.

No matter how good you get, there is always a way to improve. Trading is a learning process and is never mastered.

As Samuel Beckett wrote: "Try again. Fail again. Fail better".

Let me illustrate record keeping and its link to successful trading with an example.
Please note: I cannot respond to PM's but you can email me via my profile.
 
1
  • Post #10
  • Quote
  • Apr 8, 2011 6:36am Apr 8, 2011 6:36am
  •  the_wizard
  • | Commercial Member | Joined Jan 2007 | 1,442 Posts
I was illustrating the concept of record keeping to some traders recently.

The traders were using a discretionary entry and exit in their trades.

I got them to note down what the outcome was with their trades in terms of the number of pips made, the strike rate, the R value etc. I also got them to review the trade after they had exited and note down what would have happened using some other exit strategies.

We used some arbitrary exit strategies that were of interest (you could replace these with your own).

The first was no interaction. That means either the stop was hit or the target was hit. Nothing else is accepted.

The second was moving to breakeven when the trade is up a 0.5 R and then leaving it to either run onto the target or come back to breakeven.

The final was trailing a stop behind each hourly candle as soon as the trade is entered until either the stop is hit or the target is.

This was the outcome:

No interaction was the only one of the four exit strategies that would have made money in the period they did it for. The record provided clear and irrefutable evidence that they were right in their initial thought process (that the trade would move to the target before the stop was hit) but their discretionary management was causing them to be a losing trader.

The break even maneouvre was the second best but it still resulted in a loss over the period tested.

The third was their own discretionary management which had caused a substantial loss.

By far the worst was the trailing stop (incidentally favoured among many traders).

Now, again, this is not to say that these won't work for you because your entries will be different but what it does show you is concrete proof of what you need to do to profit.

In the above example, the trader has to simply take the trade and walk away.
Please note: I cannot respond to PM's but you can email me via my profile.
 
 
  • Post #11
  • Quote
  • Apr 8, 2011 6:56am Apr 8, 2011 6:56am
  •  the_wizard
  • | Commercial Member | Joined Jan 2007 | 1,442 Posts
Lets turn to the amateur.

In the above example, the fact that a "no interaction" based approach came out the leader doesn't mean it was a winner on every trade. It was just a clear winner over time. However, there were a few trades where "no interaction" meant that the market may have come close to the target and then resulted in a loser.

This drives the amateur mental.

The amateur, goes from one strategy to the next, always managing the next trade based on the outcome of the last one.

As a result he is always one step behind.

I've seen this time and time again.

One day he takes buys the EUR/USD and decides he is going to use no interaction. It comes close to his target and he takes a loss.

He chastises himself for being such a fool and the next trade he takes in the EUR/USD he decides to trail a stop right up behind the price to make sure that he doesn't give back his profits. This time he gets knocked out right near the beginning of the trade and then sees it hit the original target.

He is mad now, so he decides to switch back to no interaction, believing that the first time was just unfortunate. But this time the trade doesn't work out at all. It goes just half way to the target and then turns to a loser.

As a result, he now goes on the search for a totally different exit strategy that will save him in the event that it goes half way and comes back again. "I know, I'll use a breakeven stop at 0.5R", he thinks with excitement.

This trader will be in the game for years to come, wondering whether there is really any money to be made.
Please note: I cannot respond to PM's but you can email me via my profile.
 
 
  • Post #12
  • Quote
  • Edited at 9:55am Apr 8, 2011 7:09am | Edited at 9:55am
  •  the_wizard
  • | Commercial Member | Joined Jan 2007 | 1,442 Posts
This time I will use an actual trade to illustrate both the value of record keeping and why the amateur consistently fails.

Let's look at the Sunday open in FX markets.

The Sunday gap (when it occurs) is an important part of my strategy. See chart 1 for the last two I traded in the EUR/USD.

There is absolutely no excuse for not making money in this. You just have to use your record to find the right way.

Backtesting helps but as we all know, it's no substitute for live trading it where the emotions can kick in.
Attached Image (click to enlarge)
Click to Enlarge

Name: gap.jpg
Size: 71 KB
Please note: I cannot respond to PM's but you can email me via my profile.
 
 
  • Post #13
  • Quote
  • Edited at 9:42am Apr 8, 2011 7:44am | Edited at 9:42am
  •  the_wizard
  • | Commercial Member | Joined Jan 2007 | 1,442 Posts
My strike rate for the way I play these gaps is 84% at a 0.5 R. At the moment I'm on my 8th winner in a row. Every trade so far in 2011 has had a positive result.

The way I achieve that result is with a no interaction based approach.

But let's turn once again to the amateur who usually finds it hard to sit on their hands for any amount of time.

Here is what I saw someone do on this particular gap:

Point A : Market opens. Trader goes long at the open. Market moves up into profit (10 pips) so the trader moves his stop up to the lows. He has no experience of how these play out because he has done no backtesting and has kept no record. Soon after, the market starts heading south, takes the stop out for a 6 pip loss and makes a very bearish bar. Trader is OK with the small loss and thinks they have done the right thing at the close of that bearish bar. It's late in London now so they go to bed.

Point B : It's 6am. The astute trader is infront of his screens. He has seen that the market has recovered and is now on the way to the gap fill. He knows that gaps have a high hit rate and he has now seen a bullish pin bar on the hourly. There is also a minor flag here that probably looks fairly prominent on the lower time frames. Hey presto - confluence! He takes the trade long on a break of the pin and not long after he is stopped out for a 19 pip loss.

Point C : The same bar that stops the trader out ends as a bullish engulfing bar. At this point it looks like a no brainer from the price action that it's going to fill that gap in its entirety. But entering on the "trigger" of the engulfing bar leaves him only 5 pips profit to the target so instead he takes it long at the close. That alone only gives him 13 pips to the target and a potential 39 pip loss but he doesn't care about this because he is now focused on making back some of his losses and sees this as a high probability trade. Who could doubt that from the price action? He knows that the setup hasn't officially "triggered" until it breaks that high so he feels vindicated when it does in the next bar. Unfortunately, however, it misses the target by 2 pips and at this point he is relying upon the fact that I have told him it will fill to the exact close 84% of the time. He holds it and it retraces the whole bar over the next five hours and takes him out for a 39 pip loss.

Point D : The trade later trades into the Friday close. At this point the trader is angry. He is out 64 pips over three losing trades back to back. I got an easy 44 pip win out of this with absolutely no interaction.

The only reason I have the confidence to not interact is because I have a record.
Attached Image (click to enlarge)
Click to Enlarge

Name: gap_2.jpg
Size: 73 KB
Please note: I cannot respond to PM's but you can email me via my profile.
 
 
  • Post #14
  • Quote
  • Edited at 9:34am Apr 8, 2011 8:29am | Edited at 9:34am
  •  the_wizard
  • | Commercial Member | Joined Jan 2007 | 1,442 Posts
Two more things I wanted to say while we are on the subject of amateur traders.

Firstly, bet sizing. All the professionals I know, vary their bet sizing.

I think that it's been ingrained into too many traders that they need to always risk a fixed amount of their account. This would make theoretical sense if all setups were alike in their probabilities of a successful outcome. But in reality, they are not.

Since anything can happen in the market, it makes sense to have a fixed ceiling of risk which you will not breach. However, the professional trader will often vary their risk within the confines of that ceiling.

Think about it for a second. Let's say you were betting on my physical prowess in a boxing ring. I'm a skinny guy. About 5 ft 10". I never hit a person in my life. Each contestant I face in the ring is a potential trade. You can decide whether to "take it" and bet on them or not. Most traders have it ingrained in them from the advice they get from gurus to take each trade at let's say, 3% of their account (this is what I see touted most regularly).

First guy steps in. He's 6 ft 4", built like a tank. Used to be a cagefighter. Time to buy him at 3% risk.

Now, what if the dynamics changed? What if, before the fight starts, I have to wear a blindfold and get spun around 15 times? Still want to risk just 3% on this fight?

What about after blindfolding me and spinning me around, you find out I've got a fractured arm and a sprained ankle from the last fight and neither are healed. Still want to risk 3%?
Please note: I cannot respond to PM's but you can email me via my profile.
 
 
  • Post #15
  • Quote
  • Apr 8, 2011 9:32am Apr 8, 2011 9:32am
  •  the_wizard
  • | Commercial Member | Joined Jan 2007 | 1,442 Posts
The second thing I wanted to write about was risk/reward.

Too many traders get way too hung up on this element. They get it drummed into them that they need a risk/reward of 1:2 or higher. This is because supposedly its easier to get a higher R than it is to get a higher strike rate.

But R is dependent on strike rate. If your strike rate is high, your R doesn't have to be for you to have a clean curve.

The other point I want to make is that of utmost importance is the "evolving R".

Risk/Reward is not static.

Once you understand this, you can improve your success significantly.

Again, many amateurs treat trading too black and white. They think: "The trade I just took had a 1:2 when I entered (e.g it risked 20 pips to make 40) and if I can get to breakeven during the trade, then I have a risk free trade." That is as far as they take it.

But consider the following chart. See below

This is a trade I called yesterday and is the EUR/USD.

The entry was 1.4247. This trade was a simple one since it constitutes a pullback to previous resistance and went 5 pips offside.

The initial stop was 1.4229 (risk = 20 pips when factoring in spread).

The target is 1.4446 (reward = 197 pips)

Therefore the intial R is 10.

I have seen traders use a two bar stop even when price is where it currently is.

From the current bar high, the reward is: 5. The risk if the two bar stop is hit, is 43.

Your R is now 0.11.

Clever? No.
Attached Image (click to enlarge)
Click to Enlarge

Name: eur_usd.jpg
Size: 75 KB
Please note: I cannot respond to PM's but you can email me via my profile.
 
 
  • Post #16
  • Quote
  • Apr 8, 2011 9:40am Apr 8, 2011 9:40am
  •  the_wizard
  • | Commercial Member | Joined Jan 2007 | 1,442 Posts
Quoting Alexone
Disliked
Is this gonna be another thread where you post a couple of times and then abandon it? Because seems interesting so far...
Ignored
Hi Alex,

I will do my best and we can see how the thread progresses.

As a full time trader I often don't get time to post and it can be hard to sum up everything I'm thinking in a post. That's why when I do get time, I'll make a lot of posts in one go :-)

If anyone is interested, I've got some screen sharing software and I'm happy to run a free room on a Sunday evening to share the trades I've recently taken and their management and make some calls for what I'm looking out for in the week ahead. It will be a lot easier to communicate everything that way.
Please note: I cannot respond to PM's but you can email me via my profile.
 
 
  • Post #17
  • Quote
  • Apr 8, 2011 9:46am Apr 8, 2011 9:46am
  •  Chris_B
  • | Joined Jun 2009 | Status: Member | 702 Posts
Quoting the_wizard
Disliked

If anyone is interested, I've got some screen sharing software and I'm happy to run a free room on a Sunday evening to share the trades I've recently taken and their management and make some calls for what I'm looking out for in the week ahead. It will be a lot easier to communicate everything that way.
Ignored
This would be a great idea!!
I would be happy to partecipate!!

Keep your posts coming...
Market is like a puzzle, YOU have to fit the pieces!!
 
 
  • Post #18
  • Quote
  • Apr 8, 2011 11:25am Apr 8, 2011 11:25am
  •  Lovinit
  • | Joined Oct 2010 | Status: Member | 43 Posts
Quoting the_wizard
Disliked
If anyone is interested, I've got some screen sharing software and I'm happy to run a free room on a Sunday evening to share the trades I've recently taken and their management and make some calls for what I'm looking out for in the week ahead. It will be a lot easier to communicate everything that way.
Ignored
I would be very interested in that...I didn't quite get what you were saying about 'cause' rather than 'effect' in the first few posts, so it would be nice to see that in action! Count me in!
 
 
  • Post #19
  • Quote
  • Apr 11, 2011 5:36am Apr 11, 2011 5:36am
  •  Chris_B
  • | Joined Jun 2009 | Status: Member | 702 Posts
Hi The_Wizard and thank you for your great webinar...

This week there was no gap on 1H timeframe for EURUSD...but there was a gap on the 5M timeframe...

Have you traded it? Or do you consider only 1H timeframe for gaps??

It was a nice 30 pips gap and it closed perfectly...
Attached Image (click to enlarge)
Click to Enlarge

Name: eu_gap.gif
Size: 11 KB
Market is like a puzzle, YOU have to fit the pieces!!
 
 
  • Post #20
  • Quote
  • Apr 11, 2011 6:16am Apr 11, 2011 6:16am
  •  the_wizard
  • | Commercial Member | Joined Jan 2007 | 1,442 Posts
Hi Chris,

Thank you. I will make the weekly webinar a regular occurence. It was good to talk with all of you :-)

I didn't trade the EUR/USD last night as my stats are derived from the 10pm GMT open and at that time the gap was only 11 pips which is not enough for me to consider taking a trade.

But as you can see the gap was wider when your feed opened and it closed nicely.
Please note: I cannot respond to PM's but you can email me via my profile.
 
 
  • Commercial Content
  • /
  • Fail Better
  • Reply to Thread
    • Page 1 23456 305
    • Page 1 2 305
1 trader viewing now
  • More
Top of Page
Forex Factory Blog Updated: Alerting All Members
  • Facebook
  • Twitter
About FF
  • Mission
  • Products
  • User Guide
  • Media Kit
  • Blog
  • Contact
FF Products
  • Forums
  • Trades
  • Calendar
  • News
  • Market
  • Brokers
  • Trade Explorer
FF Website
  • Homepage
  • Search
  • Members
  • Report a Bug
Follow FF
  • Facebook
  • Twitter

FF Sister Sites:

  • Metals Mine
  • Energy EXCH
  • Crypto Craft

Forex Factory® is a brand of Fair Economy, Inc.

Terms of Service / ©2022