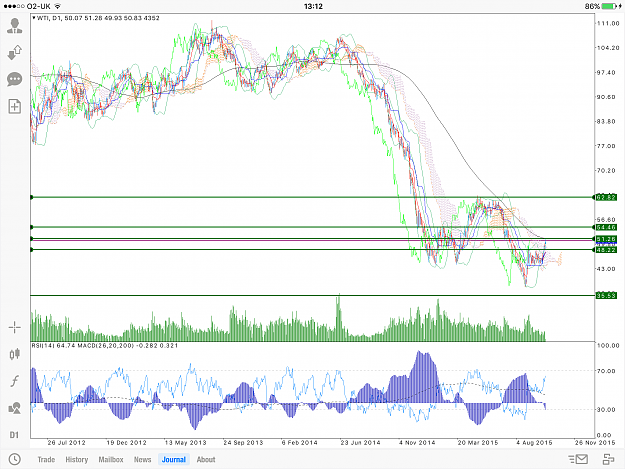
DislikedHere's a shot of my 2 day chart. The yellow horizontal line id the 61.8% fib, and the orange is the 76.4%. Either of these could act as resistance. Key for me is the 100sma which has now got underneath the price. From this chart you can see that a target of 1,1870 is not unrealistic in the weeks ahead. {image}Ignored
- #1,030,885
- Oct 9, 2015 6:58am Oct 9, 2015 6:58am
- Joined Oct 2008 | Status: sideline is a position | 105,229 Posts
those who can, do. those who cant, talk about those who can
- #1,030,890
- Oct 9, 2015 7:11am Oct 9, 2015 7:11am
- Joined Oct 2008 | Status: sideline is a position | 105,229 Posts
those who can, do. those who cant, talk about those who can
- #1,030,900
- Oct 9, 2015 7:27am Oct 9, 2015 7:27am
- Joined Oct 2008 | Status: sideline is a position | 105,229 Posts
those who can, do. those who cant, talk about those who can