• Home
  • Forums
  • Trades
  • News
  • Calendar
  • Market
  • Brokers
  • Login
  • Join
  • User/Email: Password:
  • 8:58am
Menu
  • Forums
  • Trades
  • News
  • Calendar
  • Market
  • Brokers
  • Login
  • Join
  • 8:58am
Sister Sites
  • Metals Mine
  • Energy EXCH
  • Crypto Craft

Options

Bookmark Thread

First Page First Unread Last Page Last Post

Print Thread

Similar Threads

Sidus-EMA RSI & Sidus V3 indicators that need to be fixed 18 replies

New Sidus Method v2.0 186 replies

Sidus System confirmation' indicator? 52 replies

New Sidus Method v2.0 is available 6 replies

Post your Sidus Method add on indicators here. 5 replies

  • Trading Systems
  • /
  • Reply to Thread
  • Subscribe
  • 183
Attachments: New profitable System - Sidus
Exit Attachments

New profitable System - Sidus

  • Last Post
  •  
  • 1 4041Page 424344 93
  • 1 41Page 4243 93
  •  
  • Post #821
  • Quote
  • Aug 13, 2006 10:17am Aug 13, 2006 10:17am
  •  coyan
  • | Joined Jun 2006 | Status: Member | 23 Posts
Quoting JBB
Disliked
I was talking about this indicator. I know that it's not a part of Sidus System, but it helps for any system. Sorry if it looks like offtop.
So, if you don't mind I repeat my questions:
When adding multiframe indicator to the chart
1. Do I have to change inputs other than timeframe (60 for 1H; 240 for 4 H)?
2. Do I need to observe 1H tunnel on 4H chart? Does it make sense?
3. Do we really need to observe 1D tunnel or it's too far?

Thank you.
<!-- / message -->
Ignored
Yes, it's very usefull. I have in my 30m chart mtf channel 1H and 4H with differents colors. The channels SOMETIMES are strongs s/r.

Coyan
  • Post #822
  • Quote
  • Aug 13, 2006 10:24am Aug 13, 2006 10:24am
  •  renasdad
  • Joined Mar 2006 | Status: live trader | 1,257 Posts
Quoting peterdxb
Disliked
renasdad, here is the fixed version.
Ignored
Thank you peter for working on that indicator. Also, that new indicator you have come up with also is very nice. I will keep that on my charts more for a visual. It is like a warning for a person.
JOHN 3:16
  • Post #823
  • Quote
  • Aug 13, 2006 10:32am Aug 13, 2006 10:32am
  •  renasdad
  • Joined Mar 2006 | Status: live trader | 1,257 Posts
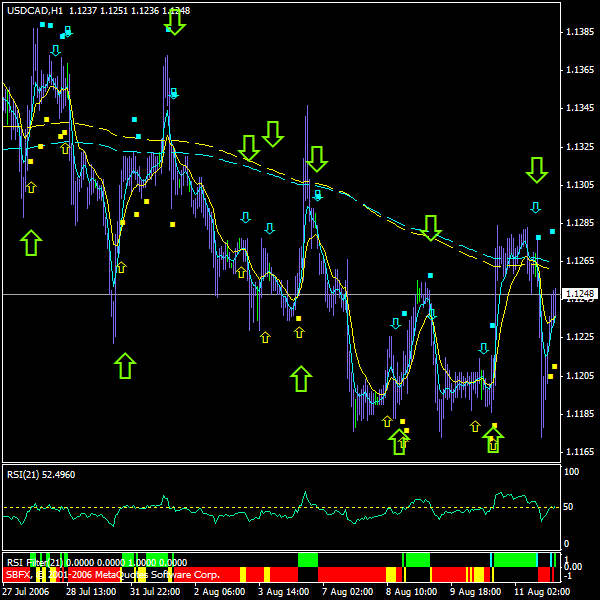
Look at all these trades that could have been taken for USDCAD. Notice there were 5/12 crosses but no RSI/50 cross. That would have kept us out.
Attached Image
JOHN 3:16
  • Post #824
  • Quote
  • Aug 13, 2006 10:49am Aug 13, 2006 10:49am
  •  JBB
  • | Joined Jul 2006 | Status: Member | 75 Posts
Quoting coyan
Disliked
Yes, it's very usefull. I have in my 30m chart mtf channel 1H and 4H with differents colors. The channels SOMETIMES are strongs s/r.

Coyan
Ignored
Yes, I like this one too. Originaly it set for 1H channel, so we have input 60.
But if we change it for 4H channel, we put 240 instead of 60, right? Do we have to change any other inputs beside this?
  • Post #825
  • Quote
  • Aug 13, 2006 10:56am Aug 13, 2006 10:56am
  •  Yardie
  • | Joined May 2006 | Status: Member | 786 Posts
Yes great work on the indicator Peter. I have a question:

1. What do the dots represent exactly? I am referring to the green and blue dots.

2. Are the arrows only paying attention to the EMA cross or EMA cross + RSI? I notice on the chart that there were times when the arrow was pointing ina direction but the RSI still was above or below 50.


Quoting renasdad
Disliked
Thank you peter for working on that indicator. Also, that new indicator you have come up with also is very nice. I will keep that on my charts more for a visual. It is like a warning for a person.
Ignored
  • Post #826
  • Quote
  • Aug 13, 2006 10:58am Aug 13, 2006 10:58am
  •  renasdad
  • Joined Mar 2006 | Status: live trader | 1,257 Posts
Quoting Yardie
Disliked
Yes great work on the indicator Peter. I have a question:

1. What do the dots represent exactly? I am referring to the green and blue dots.

2. Are the arrows only paying attention to the EMA cross or EMA cross + RSI? I notice on the chart that there were times when the arrow was pointing ina direction but the RSI still was above or below 50.
Ignored

The arrows are for the 5/12 cross. The dots are for the RSI/50 cross.
JOHN 3:16
  • Post #827
  • Quote
  • Aug 13, 2006 11:11am Aug 13, 2006 11:11am
  •  Yardie
  • | Joined May 2006 | Status: Member | 786 Posts
Very cool. Thanks.


Quoting renasdad
Disliked
The arrows are for the 5/12 cross. The dots are for the RSI/50 cross.
Ignored
  • Post #828
  • Quote
  • Aug 13, 2006 11:12am Aug 13, 2006 11:12am
  •  lietuve
  • | Joined Nov 2005 | Status: Member | 437 Posts
Quoting JBB
Disliked
Open indicator's window (now it's on the left side of your screen), click on indicator's name and drag to the RSI window. In "apply to" choose "first indicator's data" option.
Ignored
Thanks, JBB!
  • Post #829
  • Quote
  • Aug 13, 2006 11:14am Aug 13, 2006 11:14am
  •  renasdad
  • Joined Mar 2006 | Status: live trader | 1,257 Posts
Quoting JBB
Disliked
Yes, I like this one too. Originaly it set for 1H channel, so we have input 60.
But if we change it for 4H channel, we put 240 instead of 60, right? Do we have to change any other inputs beside this?
Ignored
No, you only need to change timeframe. Another thing you can do is, if you want it for daily, put ut at 1,440.
JOHN 3:16
  • Post #830
  • Quote
  • Aug 13, 2006 11:24am Aug 13, 2006 11:24am
  •  renasdad
  • Joined Mar 2006 | Status: live trader | 1,257 Posts
Quoting JBB
Disliked
Hi everyone. <?xml:namespace prefix = o ns = "urn:schemas-microsoft-com:office:office" /><o></o>

We already talked a lot about the entrance and 18/28 EMA. (By the way, Renasdad, if I get you right, you are saying that we don’t need them and they only confusing?)<o></o>

But what about exit?<o></o>

If you look at attached chart you will see thin yellow line – it’s 9SMA. (Yes, that magic one! ) <o></o>

It looks like it helps to see early exits and normally shows it twice (dark blue circles on the chart). I still can’t figure out which one to trust more. May be someone could suggest a trick to confirm line 9. <o></o>

<o></o>
Ignored
JBB,

How do you use the 9 when it is riding the 12 EMA right up/down? Also, how about when 9 hits the 12 and the move keeps going ? I will post a chart. I have the spots in question circled.
Attached Image
JOHN 3:16
  • Post #831
  • Quote
  • Aug 13, 2006 12:06pm Aug 13, 2006 12:06pm
  •  lietuve
  • | Joined Nov 2005 | Status: Member | 437 Posts
Quoting renasdad
Disliked
JBB,

How do you use the 9 when it is riding the 12 EMA right up/down? Also, how about when 9 hits the 12 and the move keeps going ? I will post a chart. I have the spots in question circled.
Ignored
I think in this case the daily chart should show the major trend. I also found the Donchian Channels quite useful for T/P or S/L - see how nicely they have enclosed the price movement.
Attached Image
  • Post #832
  • Quote
  • Aug 13, 2006 12:10pm Aug 13, 2006 12:10pm
  •  renasdad
  • Joined Mar 2006 | Status: live trader | 1,257 Posts
Quoting lietuve
Disliked
I think in this case the daily chart should show the major trend. I also found the Donchian Channels quite useful for T/P or S/L - see how nicely they have enclosed the price movement.
Ignored
You are right there. The daily is about the signal a short trade. As for the DC's, you are right again. What settings do you use for the DC's?
JOHN 3:16
  • Post #833
  • Quote
  • Aug 13, 2006 12:30pm Aug 13, 2006 12:30pm
  •  coyan
  • | Joined Jun 2006 | Status: Member | 23 Posts
Quoting JBB
Disliked
Yes, I like this one too. Originaly it set for 1H channel, so we have input 60.
But if we change it for 4H channel, we put 240 instead of 60, right? Do we have to change any other inputs beside this?
Ignored
Only change 60 to 240. (mtf indicator)

Coyan
  • Post #834
  • Quote
  • Aug 13, 2006 1:41pm Aug 13, 2006 1:41pm
  •  JBB
  • | Joined Jul 2006 | Status: Member | 75 Posts
Thanks to all for help with 1H&4H channels.

Renasdad, you right, there are so many questions regarding 9SMA. It doesn't always give a clear signal. I put white circles where I would exit (when 9 srosses or separates itself from 12). But your areas with yellow circles is a big questions. I think with help of S/R and Fibs and bla-bla would be easier.
Julia

Quoting renasdad
Disliked
JBB,

How do you use the 9 when it is riding the 12 EMA right up/down? Also, how about when 9 hits the 12 and the move keeps going ? I will post a chart. I have the spots in question circled.
Ignored
Attached Image
  • Post #835
  • Quote
  • Aug 13, 2006 5:01pm Aug 13, 2006 5:01pm
  •  emping
  • | Joined Aug 2006 | Status: Member | 2 Posts
Quoting Abid
Disliked
sorry to interupt this discussion, i'm a newbee here...just want to ask for members help to compile all the update about sidus method in one post..since i miss so much on the discussion and the update is everywhere on the post...

best regard,

abid
Ignored
it took 2 roll over to read all this but its good for your forex health
keep reading n practising
  • Post #836
  • Quote
  • Aug 13, 2006 7:24pm Aug 13, 2006 7:24pm
  •  JBB
  • | Joined Jul 2006 | Status: Member | 75 Posts
Quote
Disliked
it took 2 roll over to read all this but its good for your forex health
keep reading n practising

I agree, It took me long to read all, but it's priceless. No one can walk you through but yourself.
  • Post #837
  • Quote
  • Aug 13, 2006 11:24pm Aug 13, 2006 11:24pm
  •  Liquid11
  • | Joined Jul 2006 | Status: Forex Prospect | 62 Posts
Hey, I have created a website devoted to the teaching and research of this method for people reading this thread. I actually started it on my day off when the markets were closed. I no longer have any webspace, therefore i was forced to use the FreeWebs! Give me some ideas, and maybe some things to put on there. I know nothing is functional yet, but within time it should be 100% and a real time saver for anyone reading this thread.

Send me some PM's for suggestions. Also i can be contacted Via AIM at WatPa1ders.

http://www.freewebs.com/liquid11/

<3
  • Post #838
  • Quote
  • Aug 13, 2006 11:39pm Aug 13, 2006 11:39pm
  •  fayeez
  • | Joined Jun 2006 | Status: Member | 41 Posts
Quoting renasdad
Disliked
Look at all these trades that could have been taken for USDCAD. Notice there were 5/12 crosses but no RSI/50 cross. That would have kept us out.
Ignored
Hello renasdad , im a newbie...i noticed that you have 2 different arrows the small and the BIG ones. What are the difference and did you share it? ( or have any intention of sharing it? )
  • Post #839
  • Quote
  • Aug 13, 2006 11:50pm Aug 13, 2006 11:50pm
  •  peterdxb
  • | Joined Feb 2006 | Status: Member | 239 Posts
renasdad or anyone, has tested the rsifilter indicator i posted yesterday?
  • Post #840
  • Quote
  • Aug 14, 2006 1:44am Aug 14, 2006 1:44am
  •  sovo1970
  • | Joined Mar 2006 | Status: Member | 109 Posts
Quoting fayeez
Disliked
Hello renasdad , im a newbie...i noticed that you have 2 different arrows the small and the BIG ones. What are the difference and did you share it? ( or have any intention of sharing it? )
Ignored
I believe the big arrow is the MA cross and the small arrow is the RSI above/below 50 level..
  • Trading Systems
  • /
  • New profitable System - Sidus
  • Reply to Thread
    • 1 4041Page 424344 93
    • 1 41Page 4243 93
0 traders viewing now
  • More
Top of Page
  • Facebook
  • Twitter
About FF
  • Mission
  • Products
  • User Guide
  • Media Kit
  • Blog
  • Contact
FF Products
  • Forums
  • Trades
  • Calendar
  • News
  • Market
  • Brokers
  • Trade Explorer
FF Website
  • Homepage
  • Search
  • Members
  • Report a Bug
Follow FF
  • Facebook
  • Twitter

FF Sister Sites:

  • Metals Mine
  • Energy EXCH
  • Crypto Craft

Forex Factory® is a brand of Fair Economy, Inc.

Terms of Service / ©2021