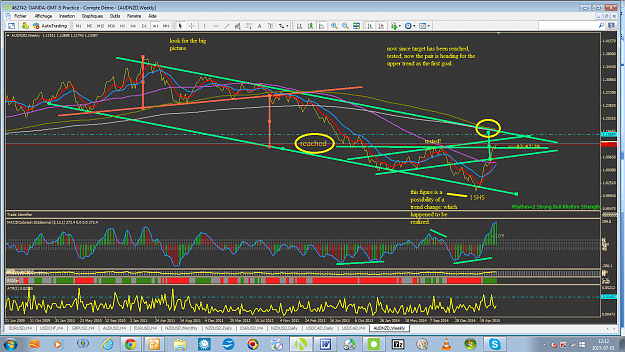
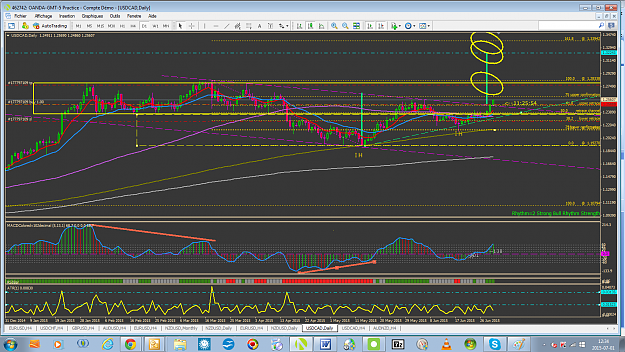
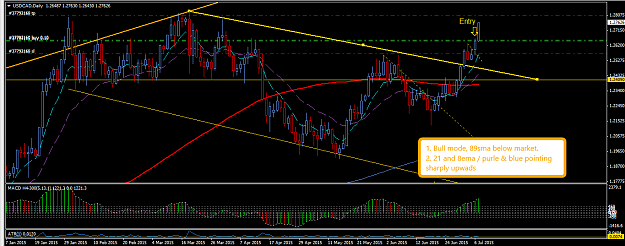
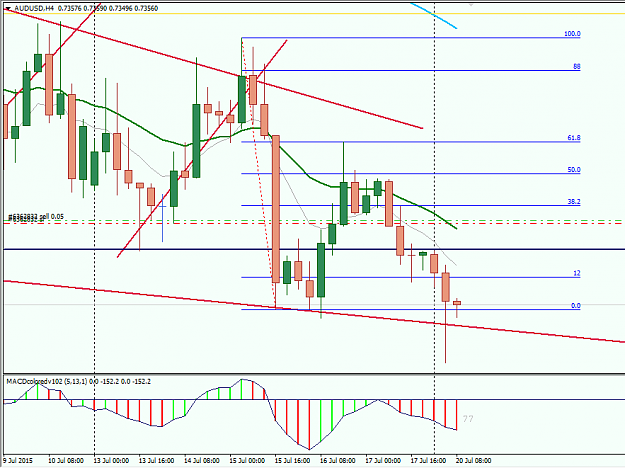
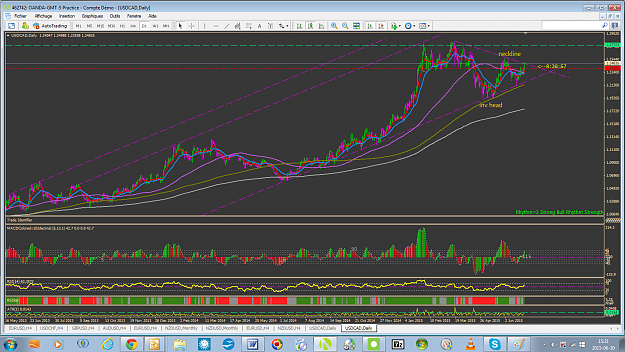
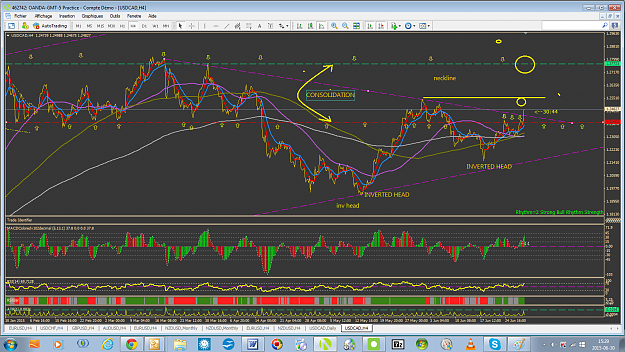
DislikedUSDCAD 30 June 2015, Tuesday Took a late entry on this. Woke up fro my sleep to realise that price has breached the neckline. It look to me a sHs pattern before the neckline was breached. Target is about 57 pips away from entry. Right now about 10 pips gained. Will see what happen in the later hours. {image} Update on USDCAD (10 hours after trade entry): Trade stopped out at 1.2363 level for a lost of 46 pips! This is at around 21ema. ATR to 73-91 pips but I didn't use that as a guideline to stop loss as I felt it was too high. Do leave me your...Ignored
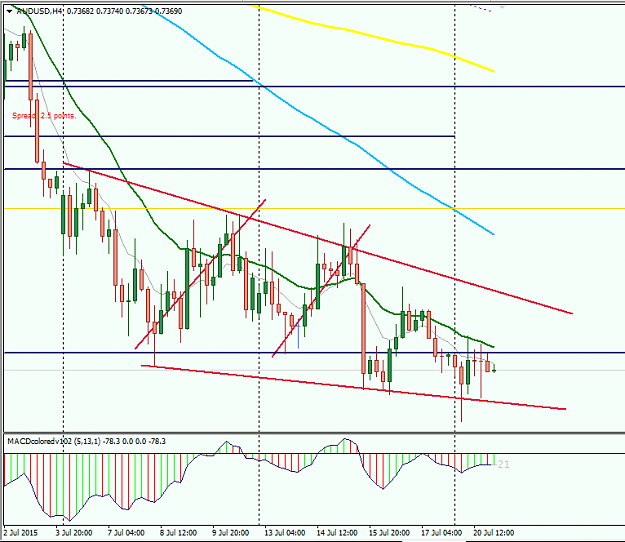
This is how I see it:
you should probably expect a pull back, SL , my guess, I would go with the ATR , 1.2335 aprox.
Attached Image(s) (click to enlarge)
Yvon