I'm going to do my next post about the latest version of my strategy which I believe is about as good as it gets, my whole trading philosophy is very simple price is either going up or down or I'm not interested, simple as that, find a chart that is trending strongly one way or the other then enter in that direction, buy bottoms of waves in an uptrend and sell tops of waves in a downtrend...
Simple as that....
But what I'm always looking for is better ways to do that , better ways to find the trend, better ways to enter, better ways to exit etc etc..
Well I think I've found something very powerful to help me with my direction, my entry and most importantly I think I've finally found my perfect exit. Not a perfect exit in that it will always get me out at exactly the right time but an exit that will deal with my inner Demon , "The Fear of Missing Out" . I now have a definite exit plan.
I'm going to use a TMA indicator for entry and most importantly for exit..
But the reason for this post is not to tell you about my strategy just yet, thats the next post. No this post, I want to deal with the biggest issue that everyone has with the TMA the problem of it repainting so back charts are of little use to test this strategy as the TMA constantly repaints...
Well I thought theres no point in building a strategy around an indicator that basically can't be trusted so I had to deal with this issue first, so I've spent the last 24 hours checking this out. But how could I check this out if it repaints??
Well luckily I had posted loads of charts Friday with signals on them so I decided to have a look at todays charts and see how these signals differed from the ones I'd posted on Friday and I'm pleased to say my conclusion is that the TMA on a one minute chart doesn't appear to suffer any repainting issues or at least not enough to mislead me and the majority of signals at the time were still there on todays charts..
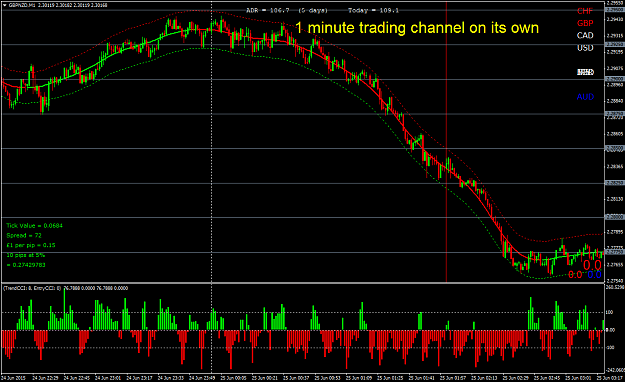
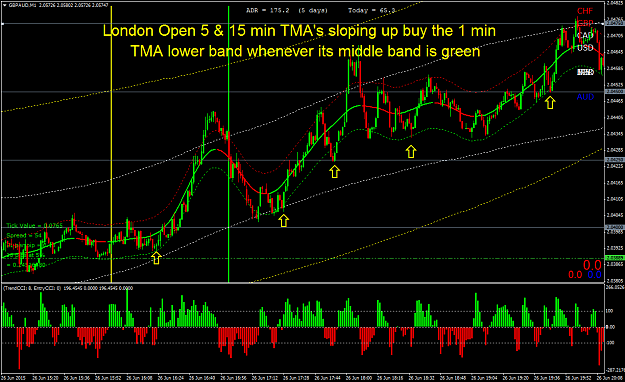
Heres one of the charts I used to check it out, this is the London Open on Friday and heres a chart I posted on Friday morning GBPNZD..
You can clearly see all the signals that morning that looked good at that time, now if there was any repainting going on then the same chart at the end of the day would surely show any repainting issues and many of the signals would not be there or even worst turn into losers..
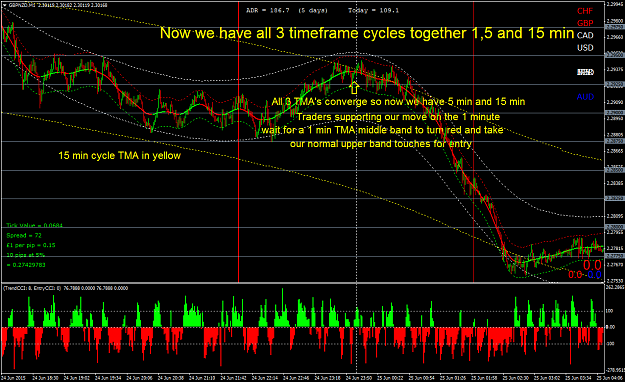
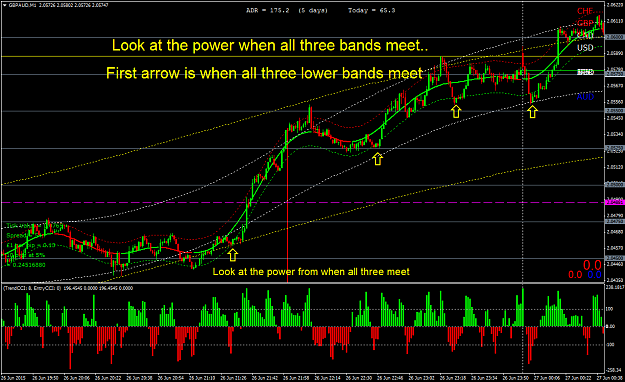
Well have a look for yourselves, what do you think of the following GBPNZD chart the same time LO but at the end of the day when any repainting would of been done by now...I've marked the end of the morning charts candles with a red vertical dotted line so we can clearly see where that mornig charts candles end..
What do you see?? Any signs of repainting??? All the mornings signals look good to me and more importantly they still look good now after the close of the market..
Further proof can be seen from the very last signal on the morning chart that touches the lower band to give us our buy signal, looking at the latest chart and we can still see the signal there exactly the same as it was at the time when I posted the first chart.
I have done the same exercise on all my charts I posted on Friday with identical results , the only problem I did note was that the middle band seemed to have changed colour sometimes but I think that would keep me out of the trade rather than suck me into a bad one.
If you don't believe me check my posted charts out for your self put the template on that I posted Friday and have a look at the charts you're see next to no difference or at least not a significant amount to effect my results. I'm wandering why this is when its obvious that many very good traders throughout FF believe there is an issue with this repainting TMA indy , however I'm wandering if its because I'm using it on a 1 minute chart and lets face it how much repainting can go on , on a 1 minute chart??? Maybe hrly , 4 hrly and daily charts would make a significant difference but not on a 1 minute?? The repaints are too small to effect the signals???
I don't know for sure if these few charts are a reliable enough sample, but its made me feel very confident that I can rely on this TMA indy for my entries and exits but I will keep a constant eye on it and whenever I take an entry I am going to take a picture so I can review the trades later and in particular see if the repainting causes me any issues. I will be checking the TMA at entry and exit to check its performance.
In my strategy I use a 15 min TMA for entries and exits but cannot check the authenticity of these signals as I haven't been trading it long enough to know but again I will be checking it out going forward with particular regards to repainting issues.
But for the time being I'm happy to proceed forward testing these TMA indys...
Right enough said about the repainting issue now onto the strategy itself...
Simple as that....
But what I'm always looking for is better ways to do that , better ways to find the trend, better ways to enter, better ways to exit etc etc..
Well I think I've found something very powerful to help me with my direction, my entry and most importantly I think I've finally found my perfect exit. Not a perfect exit in that it will always get me out at exactly the right time but an exit that will deal with my inner Demon , "The Fear of Missing Out" . I now have a definite exit plan.
I'm going to use a TMA indicator for entry and most importantly for exit..
But the reason for this post is not to tell you about my strategy just yet, thats the next post. No this post, I want to deal with the biggest issue that everyone has with the TMA the problem of it repainting so back charts are of little use to test this strategy as the TMA constantly repaints...
Well I thought theres no point in building a strategy around an indicator that basically can't be trusted so I had to deal with this issue first, so I've spent the last 24 hours checking this out. But how could I check this out if it repaints??
Well luckily I had posted loads of charts Friday with signals on them so I decided to have a look at todays charts and see how these signals differed from the ones I'd posted on Friday and I'm pleased to say my conclusion is that the TMA on a one minute chart doesn't appear to suffer any repainting issues or at least not enough to mislead me and the majority of signals at the time were still there on todays charts..
Heres one of the charts I used to check it out, this is the London Open on Friday and heres a chart I posted on Friday morning GBPNZD..
Attached Image (click to enlarge)
You can clearly see all the signals that morning that looked good at that time, now if there was any repainting going on then the same chart at the end of the day would surely show any repainting issues and many of the signals would not be there or even worst turn into losers..
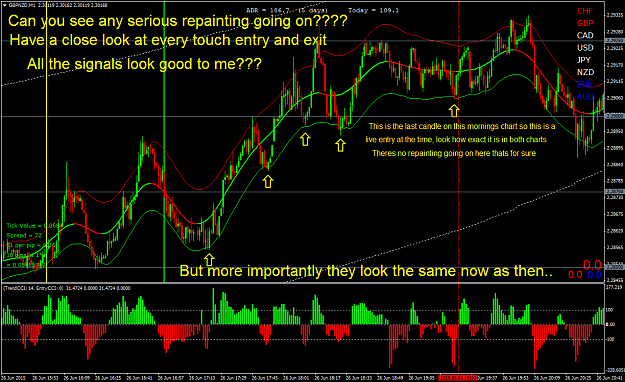
Well have a look for yourselves, what do you think of the following GBPNZD chart the same time LO but at the end of the day when any repainting would of been done by now...I've marked the end of the morning charts candles with a red vertical dotted line so we can clearly see where that mornig charts candles end..
Attached Image (click to enlarge)
What do you see?? Any signs of repainting??? All the mornings signals look good to me and more importantly they still look good now after the close of the market..
Further proof can be seen from the very last signal on the morning chart that touches the lower band to give us our buy signal, looking at the latest chart and we can still see the signal there exactly the same as it was at the time when I posted the first chart.
I have done the same exercise on all my charts I posted on Friday with identical results , the only problem I did note was that the middle band seemed to have changed colour sometimes but I think that would keep me out of the trade rather than suck me into a bad one.
If you don't believe me check my posted charts out for your self put the template on that I posted Friday and have a look at the charts you're see next to no difference or at least not a significant amount to effect my results. I'm wandering why this is when its obvious that many very good traders throughout FF believe there is an issue with this repainting TMA indy , however I'm wandering if its because I'm using it on a 1 minute chart and lets face it how much repainting can go on , on a 1 minute chart??? Maybe hrly , 4 hrly and daily charts would make a significant difference but not on a 1 minute?? The repaints are too small to effect the signals???
I don't know for sure if these few charts are a reliable enough sample, but its made me feel very confident that I can rely on this TMA indy for my entries and exits but I will keep a constant eye on it and whenever I take an entry I am going to take a picture so I can review the trades later and in particular see if the repainting causes me any issues. I will be checking the TMA at entry and exit to check its performance.
In my strategy I use a 15 min TMA for entries and exits but cannot check the authenticity of these signals as I haven't been trading it long enough to know but again I will be checking it out going forward with particular regards to repainting issues.
But for the time being I'm happy to proceed forward testing these TMA indys...
Right enough said about the repainting issue now onto the strategy itself...
Feel the Fear and do it anyway!!!