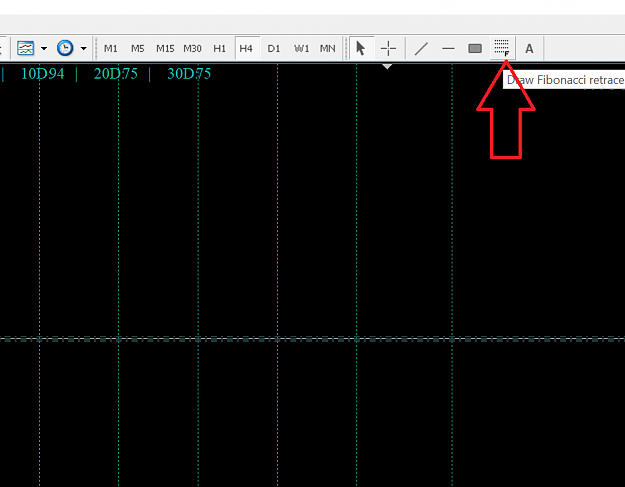
This is my 1st public trading journal outlining how I evaluate and trade the market. I will be sharing the exact way I do this, and with the tools that I use that are standard on MT4 and MT5. This 1st post is how to set up the fibonacci retracement tool with the correct numbers.
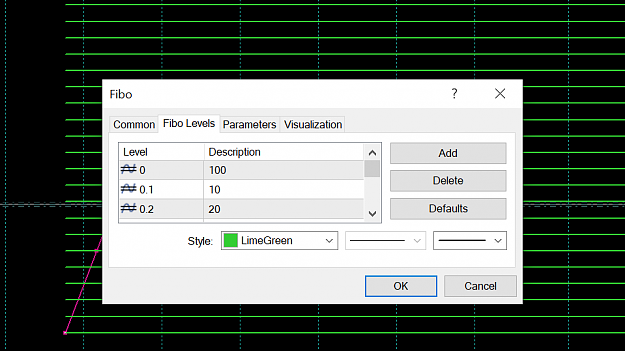
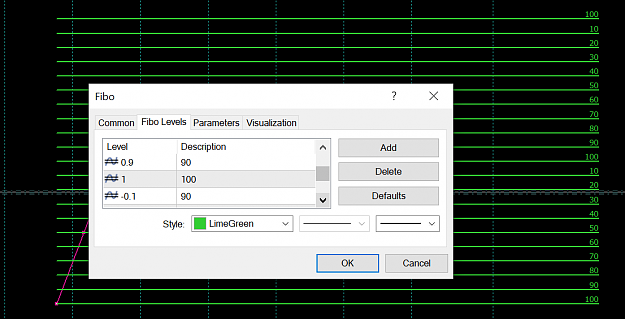
Due to the fact that the dialog box for the fibo does not expand enough to list the complete levels and description to take a picture, I will provide the list below and you will have to set those up yourself.
For those wanting to evaluate the market with the Multi-Colored Fibo here is the Guy who created it:
https://www.forexfactory.com/thread/...tracement-tool
Here is the exe:
You will have to change the levels to match mine If you want.
Check out his thread to see how to set it up, or just use the one with your platform and my settings.
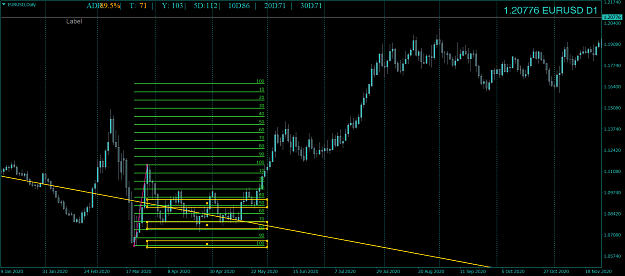
Fibonacci retracement
Level Description
0 100
0.1 10
0.2 20
0.3 30
0.4 40
0.5 50
0.6 60
0.7 70
0.8 80
0.9 90
1 100
-0.1 110
-0.2 120
-0.3 130
-0.4 140
-0.5 150
-0.6 160
-0.7 170
-0.8 180
-0.9 190
-1 200
-----------------------------
Due to the fact that the dialog box for the fibo does not expand enough to list the complete levels and description to take a picture, I will provide the list below and you will have to set those up yourself.
For those wanting to evaluate the market with the Multi-Colored Fibo here is the Guy who created it:
https://www.forexfactory.com/thread/...tracement-tool
Here is the exe:
Attached File(s)
You will have to change the levels to match mine If you want.
Check out his thread to see how to set it up, or just use the one with your platform and my settings.
Fibonacci retracement
Level Description
0 100
0.1 10
0.2 20
0.3 30
0.4 40
0.5 50
0.6 60
0.7 70
0.8 80
0.9 90
1 100
-0.1 110
-0.2 120
-0.3 130
-0.4 140
-0.5 150
-0.6 160
-0.7 170
-0.8 180
-0.9 190
-1 200
-----------------------------
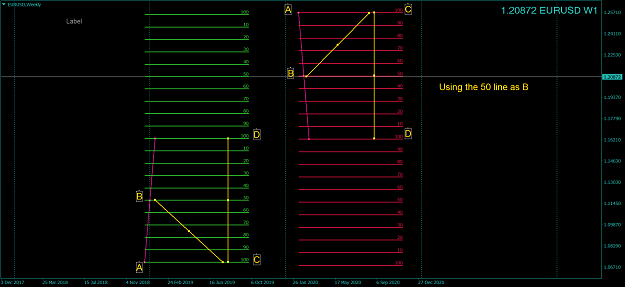
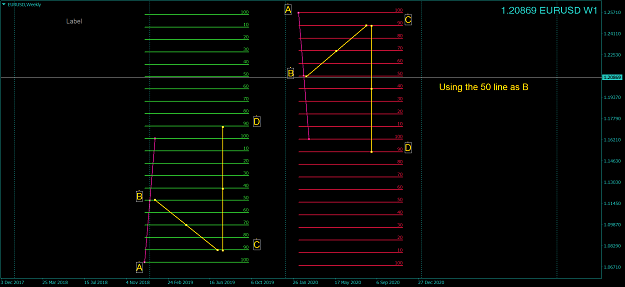
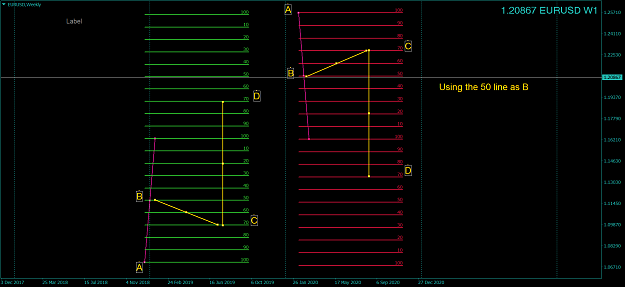
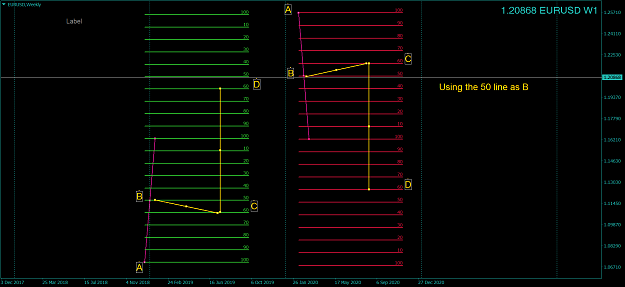
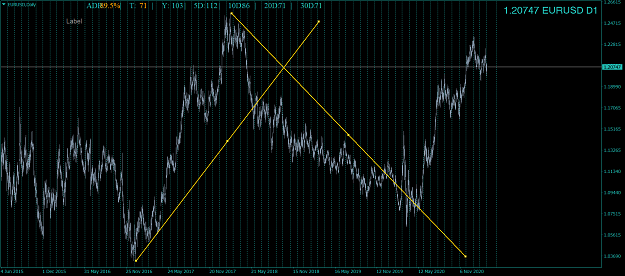
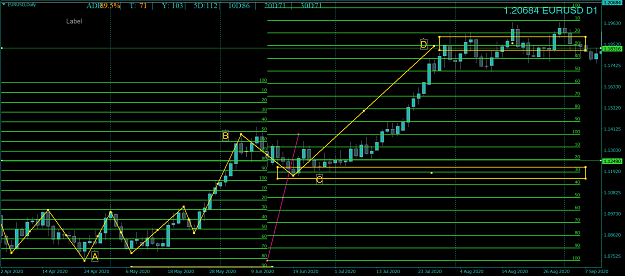
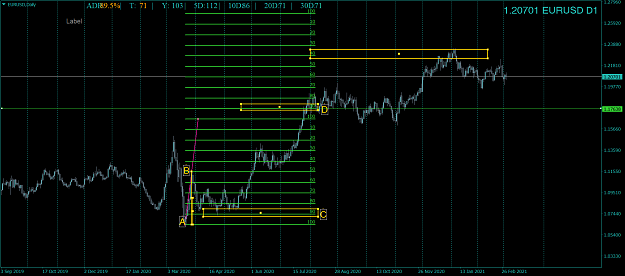
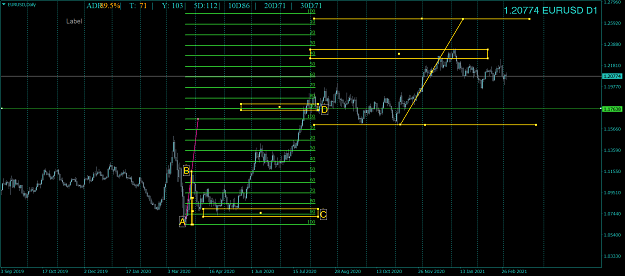
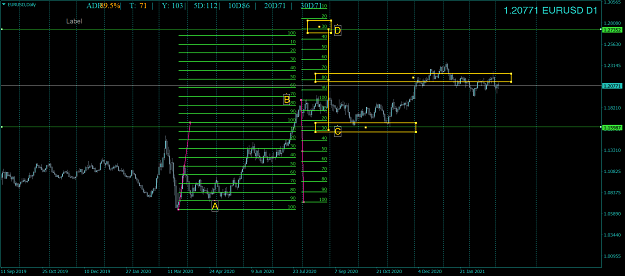
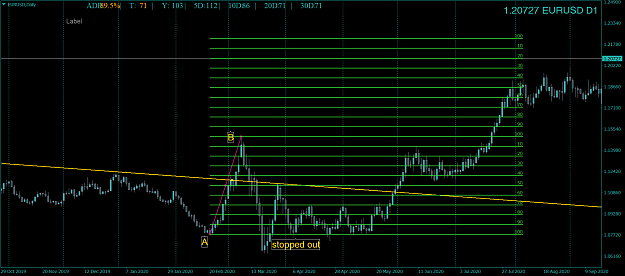
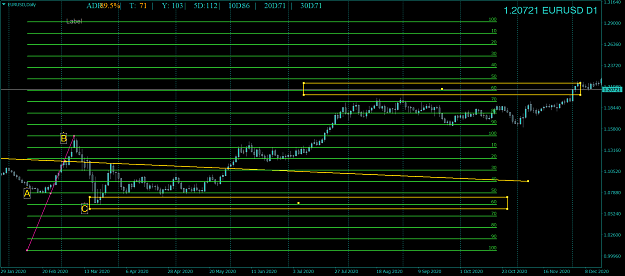
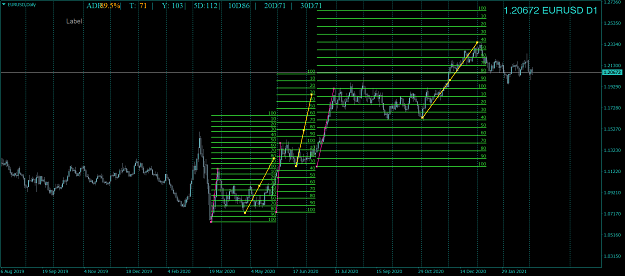
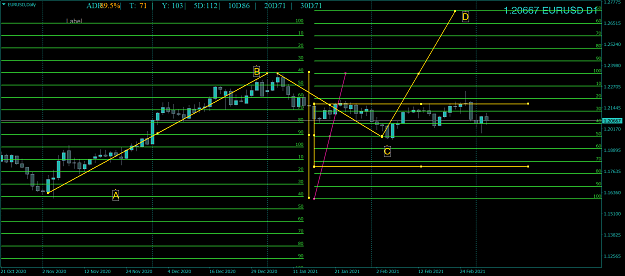
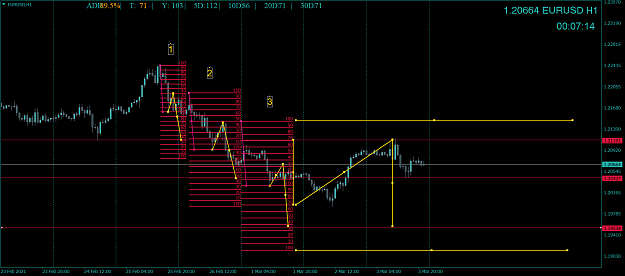
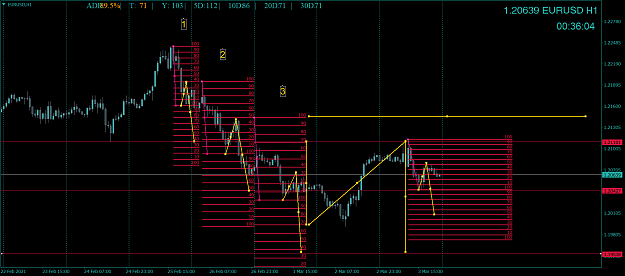
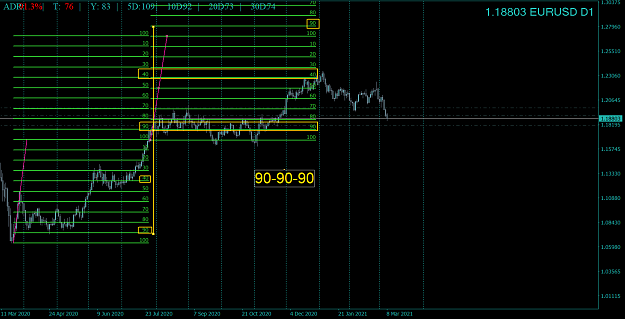
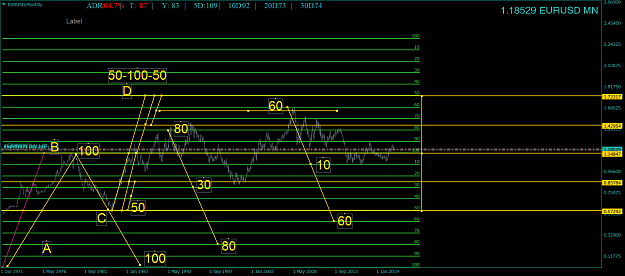
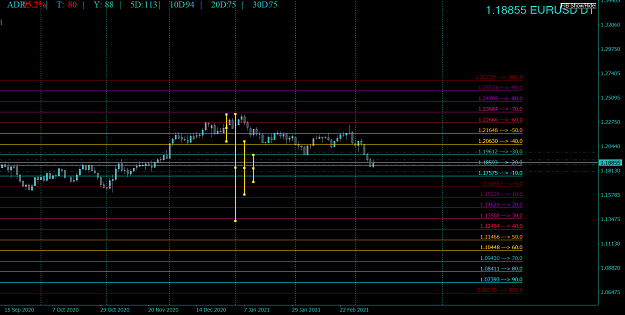
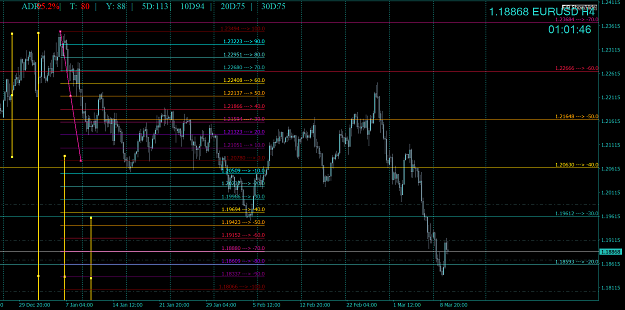
MY GRID. Markets are NOT random.