Ok, I think most people are in agreement that EurUsd and UsdChf have negative correlation
The attached picture is 3 timeframe charts of the UsdChf, from left to right is 25month, 5month and 5 week.
Yes, I understand that some would think this is for people holding positions long term, it could be, but not necessary. I you understand the long term outlook, then surely the intraday trading will be made easier
On the 25month chart, we had an inside bar which opened July 2012, that is the dash white line at 0.9476
The current 25 month bar which we are in opened Aug 2014, dashed yellow line at 0.9088
The next time frame 5 month shows that the Jan 2015 bar made a hammer. Personally I do not look at highs and lows of the candle. I am more interest in the open and the close of the previous bar. To me the candle shape is the volume.
So the previous 5 month bar closed down, with less volume than the preceding up candle. While the MACD kept making higher highs.
Then the last chart is 5 week chart. The previous candle started on 18 May and the new one starts today. I can see that the previous candle ended with up volume, albeit small.
Then I look at the macd, which was pushed down by 2 bars now, one being a high volume black candle, and the second bar being a low volume up candle.
So my 25month is still up, my 5 month macd is still up, and my 5 week macd is also up.
This 5 week candle ends July 27. And I believe today's low will be the low till Sep 2016
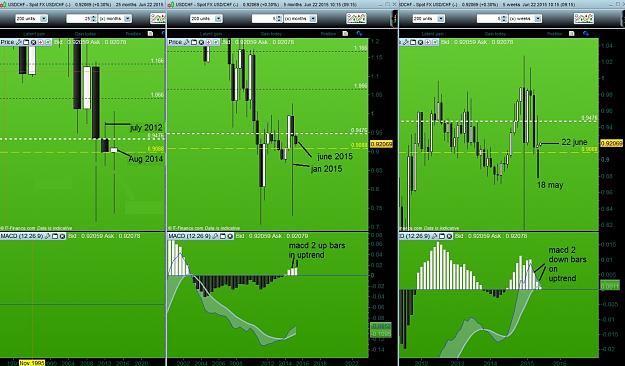
Attached Image (click to enlarge)
Forex, awful to watch, AWESOME to play