Attached Image (click to enlarge)
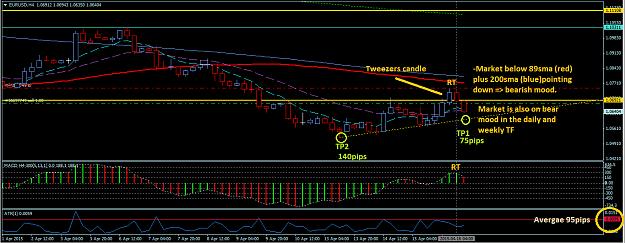
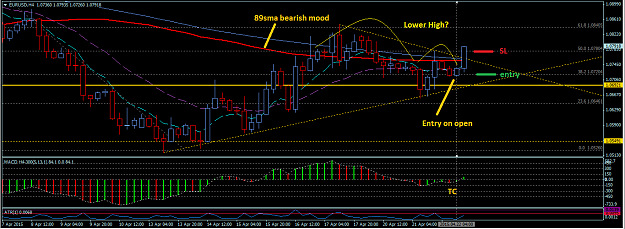
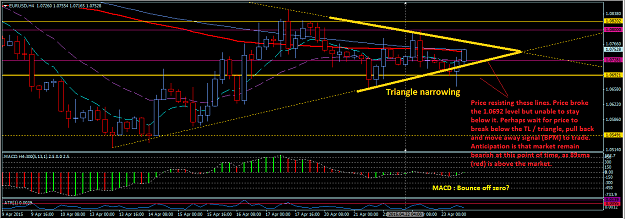
Took this a little late. Tweezers candle has formed and entered trade. Market is basically bearish on H4 TF. But also on Daily and weekly TF. Price has broke the TL at 1.0692 level. Round top is forming over four bars and felt a little shaky about that but thought it's ok to trade based on the above analysis.
Currently at 40 odd pips profit.