• Home
  • Forums
  • Trades
  • News
  • Calendar
  • Market
  • Brokers
  • Login
  • Join
  • User/Email: Password:
  • 11:30am
Menu
  • Forums
  • Trades
  • News
  • Calendar
  • Market
  • Brokers
  • Login
  • Join
  • 11:30am
Sister Sites
  • Metals Mine
  • Energy EXCH
  • Crypto Craft

Options

Bookmark Thread

First Page First Unread Last Page Last Post

Print Thread

Similar Threads

Looking for higher timeframe candlestick overlay indicator 6 replies

Beating the Odds - Edge Within a Single Candlestick (Explained) 70 replies

An Edge for an Edge (System Development) 113 replies

top 2 single candlestick pattern 7 replies

There is No Edge in a Single Candlestick 64 replies

  • Trading Discussion
  • /
  • Reply to Thread
  • Subscribe
  • 393
Attachments: Higher Edge within a Single Candlestick
Exit Attachments
Tags: Higher Edge within a Single Candlestick
Cancel

Higher Edge within a Single Candlestick

  • Last Post
  •  
  • 1 56Page 789 118
  • 1 Page 7 118
  •  
  • Post #121
  • Quote
  • Apr 11, 2015 9:57am Apr 11, 2015 9:57am
  •  NaughtyPip
  • Joined Aug 2010 | Status: Member | 1,282 Posts
Quoting sym
Disliked
{quote} Thanks Neio for this thread. This below (pics) is my contribution to statistical analysis. In one point I disagree with you: it's not 95% of times price moves away from the open. It's less. I considered O-C <= 0.5 pips and more or less only 85% of times price moves above or below the open. (at least for this pair). Anyway thanks {image}
Ignored
Can anyone explain what the columns/rows mean?
 
 
  • Post #122
  • Quote
  • Apr 11, 2015 10:38am Apr 11, 2015 10:38am
  •  Sciurus
  • Joined Oct 2012 | Status: Goodbye | 247 Posts
Hi Sym,

Nice work. But I have one question - is your data for the hourly candle? The data may differ for the daily candle.


Quoting sym
Disliked
{quote} Thanks Neio for this thread. This below (pics) is my contribution to statistical analysis. In one point I disagree with you: it's not 95% of times price moves away from the open. It's less. I considered O-C <= 0.5 pips and more or less only 85% of times price moves above or below the open. (at least for this pair). Anyway thanks {image}
Ignored
 
 
  • Post #123
  • Quote
  • Edited 6:12pm Apr 11, 2015 10:43am | Edited 6:12pm
  •  dagoods
  • Joined Nov 2007 | Status: Member | 3,037 Posts
Quoting skfx
Disliked
{quote} Ha..it's not my gift either. I'm hopeless Kinspk! Graphic below expresses my previous post visually. The graphic is raw. Other static points like bids/offers, handles/halfs, session highs/lows etc need to be used. By doing so, you'll get a running/continuous stream of feedback on EU performance. By omitting historical price prints, i cut through the bullshit and pick up almost instantly on 'right side' of trade. regards {image}
Ignored

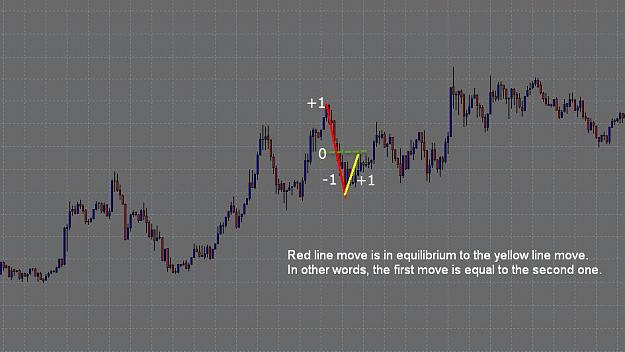
This is awesome. Price repeats with time. Waves happen. perhaps a better starting reference point can be discovered. Perhaps we can let price tell us where to start. Just an idea for discussion, Let's ask ourselves these questions, with all sincerity. Do we really want to start in the MIDDLE of nowhere? Perhaps the middle isn't the middle of nowhere after all. price told us where the middle of somewhere was, didn't it? price does reveal all. where is the beginning of a wave and where is the end? is 1 wave enough to predict a next move or at least make it trade able with good accuracy? I'm working on this myself. ah if only i could code. good discussion. Thanks for your contributions.

PS attached is a chart from another thread, someone posted, i can't recall who, that i saved. That can make for some better discussions.

PSS if price falls in a forest it DOES make a sound!
Attached Image
 
 
  • Post #124
  • Quote
  • Apr 11, 2015 10:53am Apr 11, 2015 10:53am
  •  Sciurus
  • Joined Oct 2012 | Status: Goodbye | 247 Posts
Hi skfx,

very good point. I am a bit confused about your terminology though. When you say bid/offer, I think of the dynamic path of price through time. The only what I can think of bid/offer being static is if large clumps of orders get filled at a certain price and push price. i.e. supply/demand. Can you clarify how you use the term?

Quoting skfx
Disliked
{quote} Ha..it's not my gift either. I'm hopeless Kinspk! Graphic below expresses my previous post visually. The graphic is raw. Other static points like bids/offers, handles/halfs, session highs/lows etc need to be used. By doing so, you'll get a running/continuous stream of feedback on EU performance. By omitting historical price prints, i cut through the bullshit and pick up almost instantly on 'right side' of trade. regards {image}
Ignored
 
 
  • Post #125
  • Quote
  • Apr 11, 2015 11:05am Apr 11, 2015 11:05am
  •  kinspk
  • Joined Dec 2011 | Status: Alcoholic | 1,034 Posts
Quoting sym
Disliked
{image}
Ignored
Hi Bro, do you mind share this indicator, it will be good for us to apply on different pairs.

Btw, what is the pair you applying for and what does the column "win" for. Did you use 2.4 years of data?
The only winner is the one who survive the longest...
 
 
  • Post #126
  • Quote
  • Edited 12:30pm Apr 11, 2015 12:09pm | Edited 12:30pm
  •  Nijee
  • | Joined Dec 2010 | Status: Audentes Fortuna Juvat | 169 Posts
Quoting sym
Disliked
{quote} Thanks Neio for this thread. This below (pics) is my contribution to statistical analysis. In one point I disagree with you: it's not 95% of times price moves away from the open. It's less. I considered O-C <= 0.5 pips and more or less only 85% of times price moves above or below the open. (at least for this pair). Anyway thanks
Ignored
Interesting work. Funny how people interpret the same words differently. Never thought the stat of 95 percent in the quote by Crucialpoint should be taken literally as an exact number, more as an arbitrary figure to emphasise a point of view. I interpreted that it meant that price virtually "always" moves away from the open. Could have been 90 percent, 96.5 or 94.999999, does it really matter? The quote says closes above or below the open but doesn't state how far. To me this means it moves/trends away from a reference point, regardless of how small that movement may be, that is for the market to decide.
Audentes Fortuna Juvat
 
 
  • Post #127
  • Quote
  • Edited 3:48pm Apr 11, 2015 3:34pm | Edited 3:48pm
  •  sym
  • Joined Apr 2011 | Status: Working... (too much) :) | 356 Posts
Quoting Nijee
Disliked
{quote} Interesting work. Funny how people interpret the same words differently. Never thought the stat of 95 percent in the quote by Crucialpoint should be taken literally as an exact number, more as an arbitrary figure to emphasise a point of view. I interpreted that it meant that price virtually "always" moves away from the open. Could have been 90 percent, 96.5 or 94.999999, does it really matter? The quote says closes above or below the open but doesn't state how far. To me this means it moves/trends away from a reference point, regardless...
Ignored
So let say I'll cut your salary of 10%...

what is 10%??? Nothing...

Numbers are numbers!!!! Not opinion.
--- nothing to say ---
 
 
  • Post #128
  • Quote
  • Apr 11, 2015 3:47pm Apr 11, 2015 3:47pm
  •  sym
  • Joined Apr 2011 | Status: Working... (too much) :) | 356 Posts
Quoting kinspk
Disliked
{quote} Hi Bro, do you mind share this indicator, it will be good for us to apply on different pairs. Btw, what is the pair you applying for and what does the column "win" for. Did you use 2.4 years of data?
Ignored
Hi kinspk

I think I have just shared a lot of my work on this forum and many times I didn't get a "thank you" as a reward.
I can't share anything I do, because I'm a coder (and trader) and I work for money.
I didn't tell in this thread I would have shared anything, so my answer is no.

Sorry and hope you understand!

Sym
--- nothing to say ---
 
 
  • Post #129
  • Quote
  • Apr 11, 2015 5:01pm Apr 11, 2015 5:01pm
  •  jlee425
  • | Joined Sep 2014 | Status: Member | 49 Posts
Can anyone put any examples with entry and exit
 
 
  • Post #130
  • Quote
  • Apr 11, 2015 5:15pm Apr 11, 2015 5:15pm
  •  kinspk
  • Joined Dec 2011 | Status: Alcoholic | 1,034 Posts
Quoting sym
Disliked
{quote} Hi kinspk I think I have just shared a lot of my work on this forum and many times I didn't get a "thank you" as a reward. I can't share anything I do, because I'm a coder (and trader) and I work for money. I didn't tell in this thread I would have shared anything, so my answer is no. Sorry and hope you understand! Sym
Ignored
I see, no worry Bro. It's your hardwork, understand that.
The only winner is the one who survive the longest...
 
 
  • Post #131
  • Quote
  • Edited 9:01pm Apr 11, 2015 6:34pm | Edited 9:01pm
  •  Nijee
  • | Joined Dec 2010 | Status: Audentes Fortuna Juvat | 169 Posts
Quoting sym
Disliked
{quote} So let say I'll cut your salary of 10%... what is 10%??? Nothing... Numbers are numbers!!!! Not opinion.
Ignored
Wow! Was not being negative about your analysis just stating my interpretation differs of CP's statement differed from yours. Yes, numbers are numbers but there is a difference between a number that is a known value and a number that is an estimate. My salary is a known value, at least to myself and my employer! The number of interest here is not a known value, it is an estimate.

Your analysis based on the sample used come up with a figure of 85 percent based on a single currency pair. Taking CP's figure literally, his analysis resulted in an estimate of 95 percent. We now have two estimates based on some form of analysis, 85 percent and 95 percent. What is the actual number for all pairs across all timeframes? We will never know but at least we have two figures based on some form of analysis that gives us a guide. I still stand by my comment that the actual figure is largely irrelevant, just that it is large enough that we can draw some inference from.

BTW, I actually like your analysis but more from the perspective of trend analysis, how big is a move. So thank you!
Audentes Fortuna Juvat
 
 
  • Post #132
  • Quote
  • Apr 12, 2015 1:08am Apr 12, 2015 1:08am
  •  griffinssoul
  • Joined Aug 2014 | Status: Membership Terminated | 4,544 Posts
Quoting sym
Disliked
{quote} Thanks Neio for this thread. This below (pics) is my contribution to statistical analysis. In one point I disagree with you: it's not 95% of times price moves away from the open. It's less. I considered O-C <= 0.5 pips and more or less only 85% of times price moves above or below the open. (at least for this pair). Anyway thanks {image}
Ignored
Many thanks sym for your time and effort and thanks to Neio for such an informative thread
 
 
  • Post #133
  • Quote
  • Apr 12, 2015 3:11am Apr 12, 2015 3:11am
  •  sym
  • Joined Apr 2011 | Status: Working... (too much) :) | 356 Posts
Quoting Nijee
Disliked
{quote} BTW, I actually like your analysis but more from the perspective of trend analysis, how big is a move. So thank you!
Ignored
Hi Nijee

first of all DON'T TAKE my screenshot as "GOLD" because I need to check it out. Values could be shifted of 1 hour. Let me work on it.

I don't know where CP statement came from. To say 95% of times price moves away from Open, implies to have gathered stats on any TF (1, 5, 15, 30, 60m and 4H, 1D 1W) and for how long? 1 year? 2 years? 5 years?
For the small part of stats I had seen, 95% is NOT ACCURATE.
But I don't pretend to be right, for sure CP knows the market better than me.
--- nothing to say ---
 
 
  • Post #134
  • Quote
  • Apr 12, 2015 3:41am Apr 12, 2015 3:41am
  •  zghnno
  • | Joined Feb 2015 | Status: Double the account | 239 Posts
Higher edge with a single candlestick..


What's this edge in the first place to be higher?


Is the single candlestick the current one or the previous one?

No matter what line you use if you don't factor your RR in the equation no line will help.
Double the account
 
 
  • Post #135
  • Quote
  • Apr 12, 2015 5:05am Apr 12, 2015 5:05am
  •  diceman555
  • Joined Jun 2009 | Status: Member | 5,529 Posts
Quoting jlee425
Disliked
Can anyone put any examples with entry and exit
Ignored
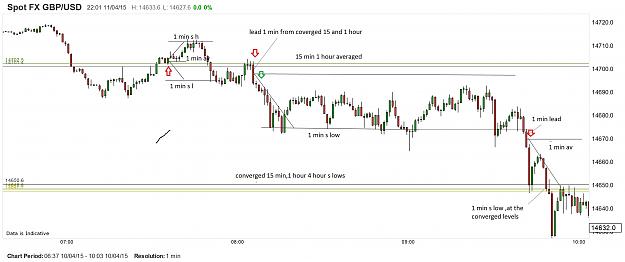
example as you requested.

i personally use averaged prices from all time periods and ,there potential energy,i trade from 1 min t/f.using related values as my fixed ref point ,ie 0 being rolled at end of n/y.so im always aware of the flat level across the market in generall.i look for converged price levels .my bias is determined from the values of which i can determine range trend agreement ect,i scalp the 1 min cycles .

so my reference is a market impression,i work right down to 1 min and enter from the quotes
Attached Image (click to enlarge)
Click to Enlarge

Name: chart.jpg 1 min.jpg
Size: 343 KB
 
 
  • Post #136
  • Quote
  • Apr 12, 2015 5:18am Apr 12, 2015 5:18am
  •  diceman555
  • Joined Jun 2009 | Status: Member | 5,529 Posts
using fridays chart and trading as my example,

pre london i could determine that the overall market had 90 % agreement,ie selling pounds euros ect,buying dollers and yen.

the larger t/f averages supported this bias

trading below the averages ,on a 1 min chart i take the average price and now have a now moment reference supported by all the above ,

i take my entry from that point

fridays trading the market was in synce and total agreement,the majority of the time this is not the case,the market conflicts,this can be determined from the overall market values as the main point of reference,again 0 being rollover.when in confliction the market ranges.in these cases you can determine the market stall point.these are the points you enter short or long to scalp the range dependent obviously on were the price within the range being
 
 
  • Post #137
  • Quote
  • Apr 13, 2015 5:08am Apr 13, 2015 5:08am
  •  skfx
  • Joined May 2006 | Status: Member | 537 Posts
Quoting dagoods
Disliked
{quote} This is awesome. Price repeats with time. Waves happen. perhaps a better starting reference point can be discovered. Perhaps we can let price tell us where to start. Just an idea for discussion, Let's ask ourselves these questions, with all sincerity. Do we really want to start in the MIDDLE of nowhere? Perhaps the middle isn't the middle of nowhere after all. price told us where the middle of somewhere was, didn't it? price does reveal all. where is the beginning of a wave and where is the end? is 1 wave enough to predict a next move or...
Ignored
Reference points we use, should be reference points important for everyone and in particular institutional traders.
Arbitrary reference points are just that, arbitrary.Who is interested in random/arbitrary reference points?
When the NY bell rings and you're an equity trader, what tends to get stuck in your mind? When the NY bell closes, what tends to get stuck in your mind?


Attached Image (click to enlarge)
Click to Enlarge

Name: guff.png
Size: 37 KB

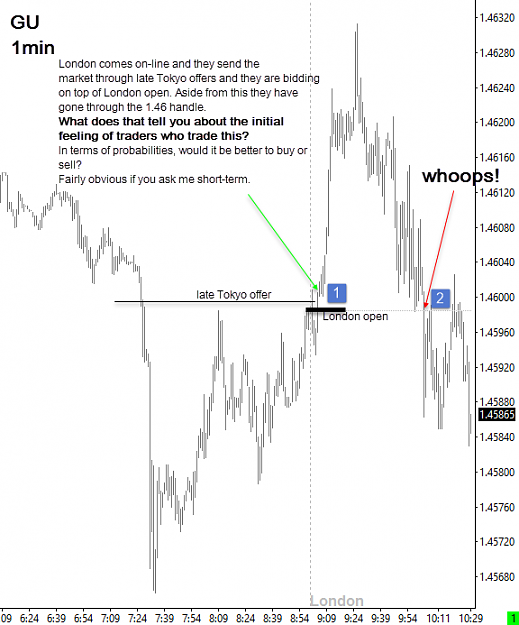
What are we trading above?
We are trading the performance of the British Pound against the US dollar and we are doing this short-term.
#1 We see when London comes online, there is an initial push downwards which is also from the late Tokyo offer.
Interestingly, they reject downside trade. i'll say that again...they reject downside trade. If they reject downside trade, then we either move into neutral sentiment or we go bid.
Obviously, if we cannot break above the London open and crack Tokyo offer i'm neutral.
By breaking out above the London open and trading on top of the Tokyo offer it is confirmation of sellers failing to run it downside. I then expect the British Pound to outperform the US dollar while we trade on top of these static reference points.

#2 1 hour later after testing topside trade the Pound trades lower and now tests the London open, Tokyo offer and 1.46 handle.
Notice what happens? We crack the bid/buyer fails to hold trade at the handle. What happens when a buyer fails to hold bid? We go neutral to offer.
Market now uses 1.46/London open/Tokyo-London pivot to work downside from. That is a starting point for working the offers and it is lowest risk price on the short side of trade.

You think i'm the only one looking at these points of reference? There are bigger fish than myself trading around these points. I can assure it's not me flipping the market from buy side to sell side lolol
I let the market tell me which side to work and i throw all other shit aside. He doesn't care what indicators i have, and he doesn't care what chart patterns i think are important. He doesn't give two shits about a bias i have or what i want it to do.
I just listen. He wants me to flip, i'll flip.

Regards
 
1
  • Post #138
  • Quote
  • Apr 13, 2015 5:23am Apr 13, 2015 5:23am
  •  skfx
  • Joined May 2006 | Status: Member | 537 Posts
Quoting Sciurus
Disliked
Hi skfx, very good point. I am a bit confused about your terminology though. When you say bid/offer, I think of the dynamic path of price through time. The only what I can think of bid/offer being static is if large clumps of orders get filled at a certain price and push price. i.e. supply/demand. Can you clarify how you use the term? {quote}
Ignored
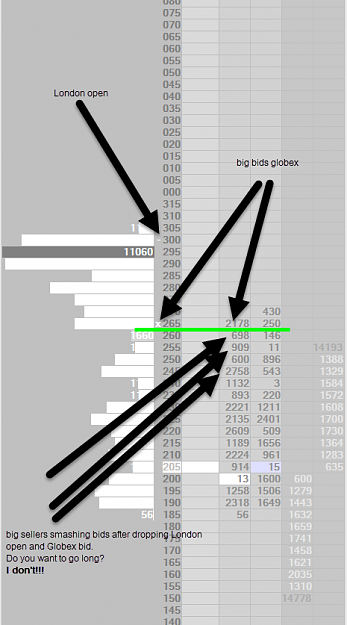
Sciurus, i have placed a DOM of the UST 10s.

Quite simply it shows bids/offers in terms of actual data and not just a graphic, like a chart.
If you are shorting the market or working offers after dropping London open and trading through big Globex bids then you are a very smart trader.
You are very smart trader getting paid.
By dropping these static reference points, the market is telling you to get short. The market is telling you that the 10's are under performing in terms of pricing or that yields are currently rising.

The premise is the same as my previous post. If a buyer cannot hold a bid and it's dropped, then it really isn't the best sign for long side trade.
And as a seller if you're working off the back of these broken buyers, you'll get paid.
Hope this helps.

Regards.
Attached Image (click to enlarge)
Click to Enlarge

Name: UST10s.png
Size: 69 KB
 
 
  • Post #139
  • Quote
  • Apr 13, 2015 11:01am Apr 13, 2015 11:01am
  •  Sciurus
  • Joined Oct 2012 | Status: Goodbye | 247 Posts
Quoting skfx
Disliked
{quote} Sciurus, i have placed a DOM of the UST 10s. Quite simply it shows bids/offers in terms of actual data and not just a graphic, like a chart. If you are shorting the market or working offers after dropping London open and trading through big Globex bids then you are a very smart trader. You are very smart trader getting paid. By dropping these static reference points, the market is telling you to get short. The market is telling you that the 10's are under performing in terms of pricing or that yields are currently rising. The premise is...
Ignored
skfx,

​You're a gem. Thanks. There are so many nuggets and kernels in your last two posts. I can understand what you are saying about price smashing through bids being a bearish sentiment. However, I'm completely unfamiliar with treasury notes, so it will take me some time to walk through the mechanics of it.
 
 
  • Post #140
  • Quote
  • Apr 13, 2015 2:42pm Apr 13, 2015 2:42pm
  •  skfx
  • Joined May 2006 | Status: Member | 537 Posts
Quoting Sciurus
Disliked
{quote} skfx, ​You're a gem. Thanks. There are so many nuggets and kernels in your last two posts. I can understand what you are saying about price smashing through bids being a bearish sentiment. However, I'm completely unfamiliar with treasury notes, so it will take me some time to walk through the mechanics of it.
Ignored
The fact that you see this Sciurus, places you above most!

It's not important what market it is, it could have been corn futures or Swiss francs.
The mechanics are the same for every market.
Performance is performance.

Good trading to you!
Regards
 
 
  • Trading Discussion
  • /
  • Higher Edge within a Single Candlestick
  • Reply to Thread
    • 1 56Page 789 118
    • 1 Page 7 118
1 trader viewing now
  • More
Top of Page
  • Facebook
  • Twitter
About FF
  • Mission
  • Products
  • User Guide
  • Media Kit
  • Blog
  • Contact
FF Products
  • Forums
  • Trades
  • Calendar
  • News
  • Market
  • Brokers
  • Trade Explorer
FF Website
  • Homepage
  • Search
  • Members
  • Report a Bug
Follow FF
  • Facebook
  • Twitter

FF Sister Sites:

  • Metals Mine
  • Energy EXCH
  • Crypto Craft

Forex Factory® is a brand of Fair Economy, Inc.

Terms of Service / ©2023