Suggested video before going into the thread
A lot of traders (and wannabes) in this forum know who is CP and a portion of them have attempted to decipher his system and find the indicators he uses. I dont know him or how he trades, if he even uses indicators or what his system is like, nor do I care. However I read part of what he shared among it a phrase, "95% of the time price will close above or below the open, within this statement lies a pot of gold" which reduced to its lowest terms would be Price will trend from the open to the close 95% of the time.
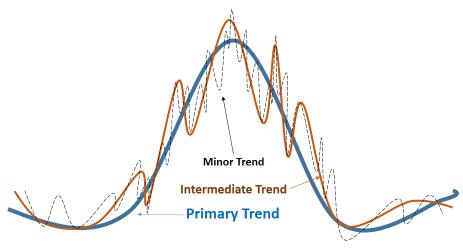
So, what is a trend? A trend is: A general direction in which something is developing or changing. or a pattern of gradual change in a condition, output, or process, or an average or general tendency of a series of data points to move in a certain direction over time, represented by a line or curve on a graph.
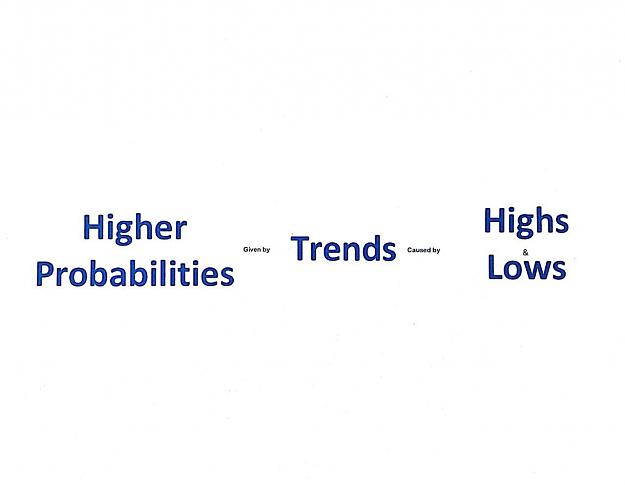
What causes a trend and why is it important? A trend is caused by a sequence of high/lows and its important because it will give you a higher probability of reaching your take profit if you trade according to its direction.
So, if most of the time, 95% of the time for example, price will trend and if you follow the trend then you will have an edge and if you have an edge you can beat the odds.
But, how do you determine the trend THE RIGHT WAY? Should you use Moving Averages, TrendLines, MACD, RSI, insertindicatornamehere? The answer is NO. Actually you dont need indicators or lines, all you need is a reference point (candlestick open if you are slow and didnt notice by now) to determine trend. Yes, thats right, thats the only thing you actually need, nothing else. I mentioned earlier a trend is ...a tendency of a series of data points to move in one direction over time...
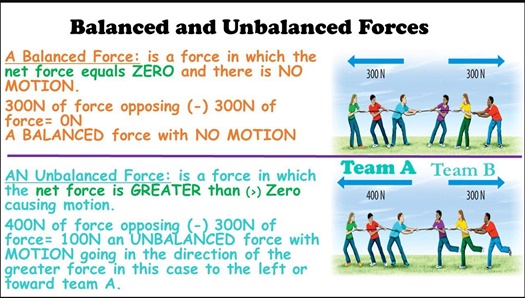
Now, watch the following illustration of very simple information concerning balanced and unbalanced forces.
I must say, we as retail traders are unable to move the market with our trading orders, we are subject to the direction the market is going and can do nothing to change it at will. Having said that, we must face trading as if we were betting. While, betting is a form gambling, it is slightly less risky and less uncertain than the former. Betting is defined as predicting the outcome of a future event and placing ‘a wager’ on that outcome. It is a simple attempt to win money by carefully predicting the outcome of a betted event. Here, the skills of a person might help as on the basis on an event, he or she can do some research and predict the outcome of the betted event. read more
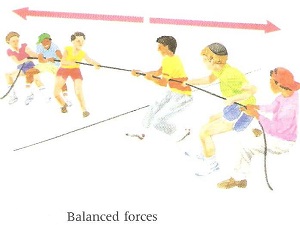
Now look at the following illustration. What would the candlestick open be represented like in it? Thats right the line in the ground.
Now look at the following illustration and pick a side, ask yourself a few things. 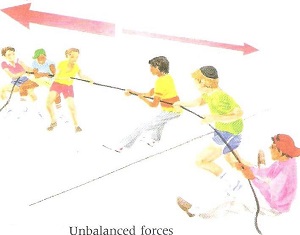
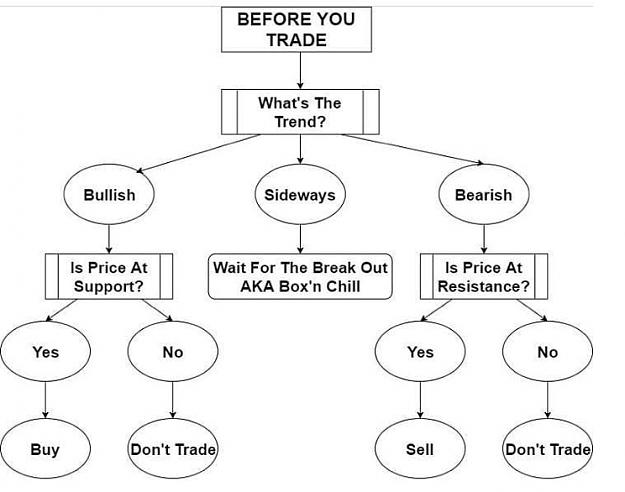
Now for the practical part. There are few and simple steps to follow. 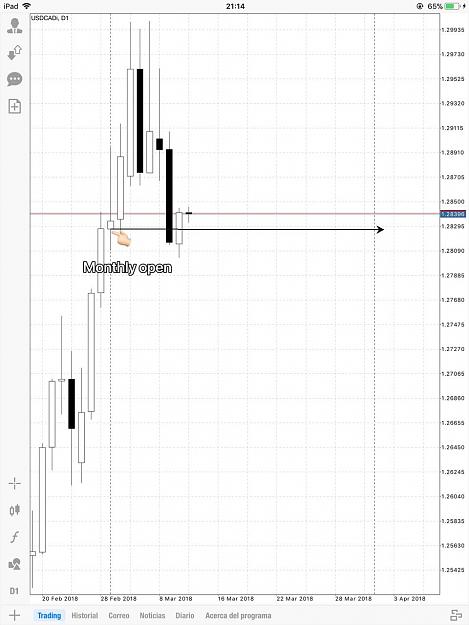
I am sure this is simple enough, you may want to print this and read it a few times. There are many other ways in which you can take advantage of the trend, for example if you see price above daily open and see a triangle pattern breaking to the upside, the probabilities are on your side. You dont need indicators to determine trend. This is the right way to determine trend and thats a fact. I dare you to prove me wrong in this, if you come up with a way to prove I am wrong and this is not the right way to determine trend let me know below. see also
FOREX TRADING IS SIMPLE
I´m sitting in front of my computer thinking how to create this thread in the better way possible. About 30 minutes have gone by and the best way I can think of doing so is keeping things as simple as possible. So Let´s begin. Please make sure you have at least, average reading comprehension skills, the more the better. If not, please follow the link at the left, upper corner. Thanks. Stupid questions from spoon feeding requesters and lazy people will be ignored and hidden.A lot of traders (and wannabes) in this forum know who is CP and a portion of them have attempted to decipher his system and find the indicators he uses. I dont know him or how he trades, if he even uses indicators or what his system is like, nor do I care. However I read part of what he shared among it a phrase, "95% of the time price will close above or below the open, within this statement lies a pot of gold" which reduced to its lowest terms would be Price will trend from the open to the close 95% of the time.
So, what is a trend? A trend is: A general direction in which something is developing or changing. or a pattern of gradual change in a condition, output, or process, or an average or general tendency of a series of data points to move in a certain direction over time, represented by a line or curve on a graph.
What causes a trend and why is it important? A trend is caused by a sequence of high/lows and its important because it will give you a higher probability of reaching your take profit if you trade according to its direction.
So, if most of the time, 95% of the time for example, price will trend and if you follow the trend then you will have an edge and if you have an edge you can beat the odds.
But, how do you determine the trend THE RIGHT WAY? Should you use Moving Averages, TrendLines, MACD, RSI, insertindicatornamehere? The answer is NO. Actually you dont need indicators or lines, all you need is a reference point (candlestick open if you are slow and didnt notice by now) to determine trend. Yes, thats right, thats the only thing you actually need, nothing else. I mentioned earlier a trend is ...a tendency of a series of data points to move in one direction over time...
Now, watch the following illustration of very simple information concerning balanced and unbalanced forces.
Attached Image
I must say, we as retail traders are unable to move the market with our trading orders, we are subject to the direction the market is going and can do nothing to change it at will. Having said that, we must face trading as if we were betting. While, betting is a form gambling, it is slightly less risky and less uncertain than the former. Betting is defined as predicting the outcome of a future event and placing ‘a wager’ on that outcome. It is a simple attempt to win money by carefully predicting the outcome of a betted event. Here, the skills of a person might help as on the basis on an event, he or she can do some research and predict the outcome of the betted event. read more
Now look at the following illustration. What would the candlestick open be represented like in it? Thats right the line in the ground.
Attached Image
Now look at the following illustration and pick a side, ask yourself a few things.
- Which team would you place a bet 1:10 risk reward that its going to be the winner?
- Do you think its 100% sure you will win?
- Do you think probabilities are on your side?
- What if you place bets on 3 matches and win 1 out of 3 times, or win 2 out of 3 times, or win every time?
- Would you still be in profit at the end of the day?
- Would you pick your side before the match even starts or rather place bets when you see a team is winning it (you can place bets even if it has already started)?
- Would you be patient enough towait until it is clear who is winning to place your bet?
Team on the right are the bulls and team on the left are bears
Attached Image
Now for the practical part. There are few and simple steps to follow.
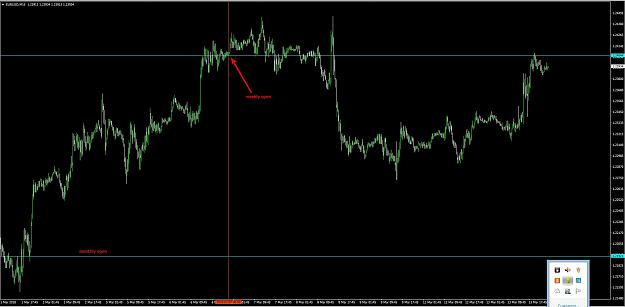
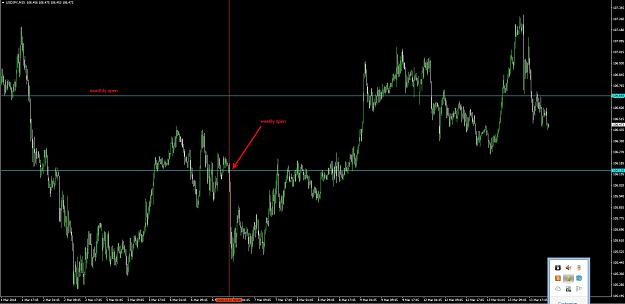
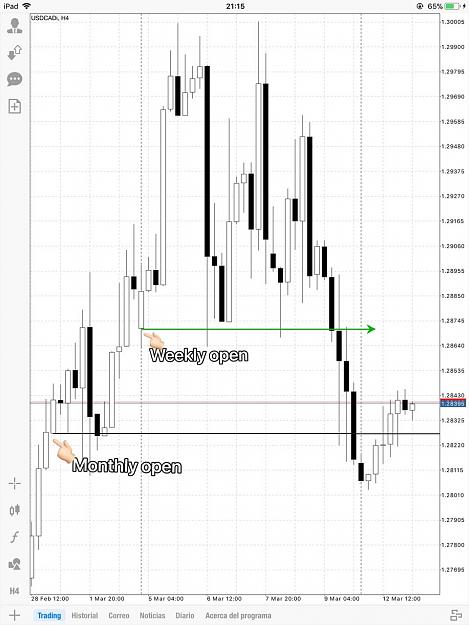
- Go to Daily chart for any pair and draw a line at the open of the first CS of the month
- Go to H4 chart for any pair and draw a line at the open of the first CS of the second week of the month
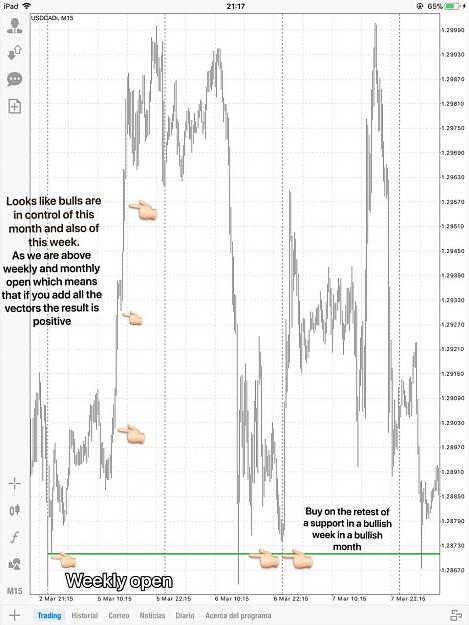
- Go to M15 chart for any pair and wait for the retest of the weekly open line. If we are above it and we are also above the monthly open line, buy. If we are below the line and also below the monthly open line, sell.
Attached Image (click to enlarge)
Attached Image (click to enlarge)
Attached Image (click to enlarge)
I am sure this is simple enough, you may want to print this and read it a few times. There are many other ways in which you can take advantage of the trend, for example if you see price above daily open and see a triangle pattern breaking to the upside, the probabilities are on your side. You dont need indicators to determine trend. This is the right way to determine trend and thats a fact. I dare you to prove me wrong in this, if you come up with a way to prove I am wrong and this is not the right way to determine trend let me know below. see also
Attached Image (click to enlarge)
Attached Image (click to enlarge)
Attached Image
Attached Image (click to enlarge)
Grind until you no longer have to introduce yourself. 4:30am club