DislikedJust did a short experiment showing how support & resistance could simply be random lines on your chart.. https://www.youtube.com/watch?v=EKpzSv6rw_s Feel free to try out this little experiment yourself. As always, comments are welcomed and encouraged. Cheers! fartistIgnored
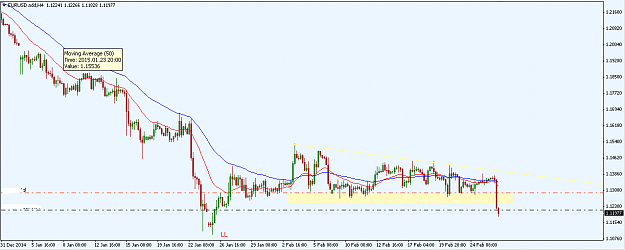
For trend traders, too much attention to S/R can actually undermine the ability to let profits run or jump into a trend in the first place. I must admit, initially when I commenced trend trading I used to pay too much attention to these levels in my decisions on whether or not to enter a trade and whether there was sufficient blue sky in an infant trend to deliver a positive return. It was only after I missed some significant trend trading opportunities that I decided that too much attention to S/R can undermine trend trading opportunities. Nowadays, I only use S/R as a guide to assist me in determining suitable trade entry points only. Once the trend gets going with a bit of momentum, they tend to slice through S/R like butter so their use after entry is really immaterial to trend following techniques.
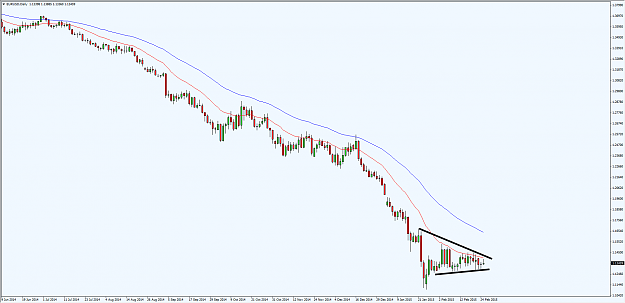
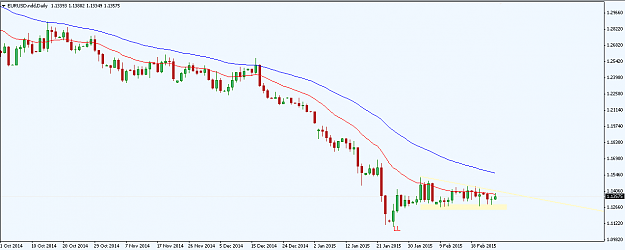
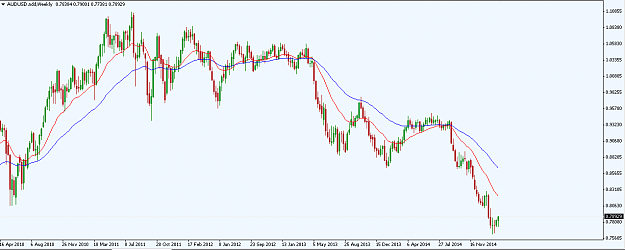
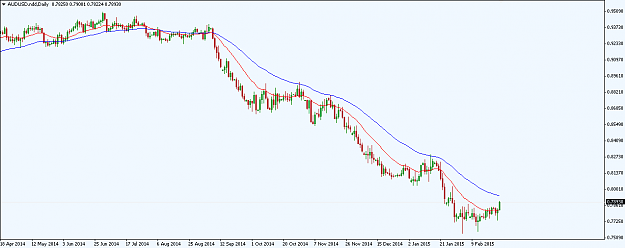
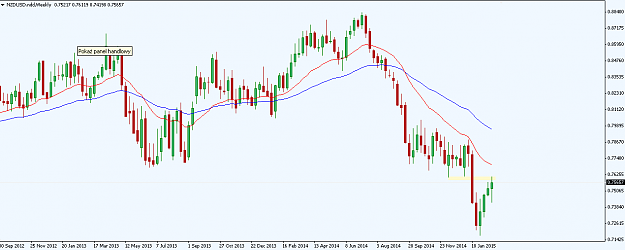
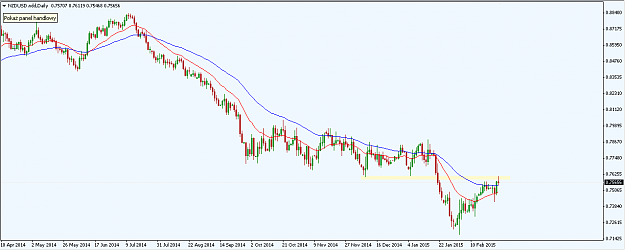
You are also spot on in my opinion that it is only the longer term high's/lows on D1, W1 and MN timeframes that are worthwhile keeping an eye on in determining trend trading opportunities and this in my opinion is more for the purposes of confirming potential breakout zones that can be utilised by trend followers.
Your demonstration certainly adds weight to this conclusion that perhaps we are reading to much into random price action and to stay focussed on simply determining whether or not a trend of substance exists. Thanks a lot for your insight here. :-)