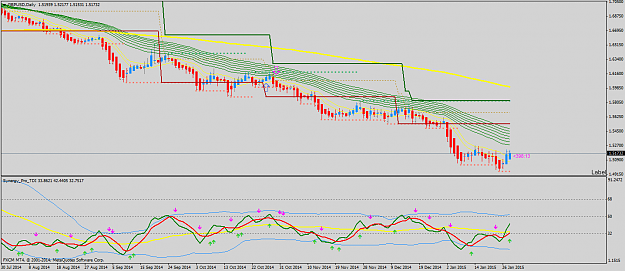
{quote} Your GU H1 Dots levels are different to mine? Did you change the settings? I'm in the UK and my broker is GMT time. Any ideas why? {image}
Ignored
By the look of it your DOTS opens at Midnight - check in the settings for the DOTS indicator - choose the session you want to trade and the levels with then correspond with the preceeding PA for the entry and exit levels provided. My settings were foe the London session, so all the Tokyo channel PA had taken place and the levels shown on my screen shot become the new targets for the period to the NY open. Hope that makes sense. Thanks
[Quote = mch1970; 8029433] {quote} Hi Emm - conseguiu uma entrada sobre GU utilizando os níveis de DOTS LO, para entrada e saída. 2 lotes - TP1 bateu @ 20 pips e TP2 @ 35pips. {imagem} [/ quote] Hello you can post this indicator?
Thank U
[Quote = mch1970; 8029433] {quote} Hi Emm - conseguiu uma entrada sobre GU utilizando os níveis de DOTS LO, para entrada e saída. 2 lotes - TP1 bateu @ 20 pips e TP2 @ 35pips. {imagem} [/ quote] Hello you can post this indicator? Thank U {image}
Ignored
Hi macdh4 - you need the DOTS indicator version 3 - it's in the paperclip at the top right of this page along with countless others.
[Quote = mch1970; 8029433] {quote} Hi Emm - conseguiu uma entrada sobre GU utilizando os níveis de DOTS LO, para entrada e saída. 2 lotes - TP1 bateu @ 20 pips e TP2 @ 35pips. {imagem} [/ quote] Hello you can post this indicator? Thank U {image}
Ignored
Hi u can find it in the "paperclip"....scroll until u find DOTS version 3 (EDUCATION) . DON'T USE VERSION 4.2!!! it's locked from security reasons by CompassFx.
hi all, have been off trading for sometime. I just came back and when I logged onto my platform (Alpari uk), I discovered that their signals have been frozen. On checking, I found they are into receivership. Now, I need to get another non American broke, so I need good advice on this, pls. Thks.
Good morning everyone!
(7:30 a.m. my time, N/Y session)
What I see is a consolidation in a lot of the pairs.
On the longer time frames (daily chart).
If your in trades & the market is in consolidation mode,
I'll use a set & forget method and just let my open trades
ride it out.
When I like the long term direction (flowing with the guppy's).
and I know where my levels are (lot's of room) I'll ride the
consolidation out and let my stop do all the work. Their is not
much we can do about consolidation...we just have to bear with it.
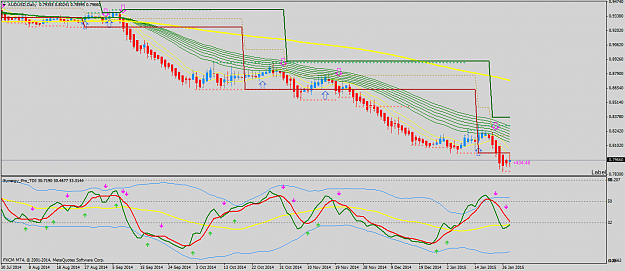
See how price broke through the "Dsr level" went down (bottomed)
and retraced back to the dsr. Some people would see a 1-2-3 pattern.
You want to look for 1-2-3 patterns...
sj
I have a question about trading away from the daily open, as i read about it several times i think i still did not really understand how it's meant to be done.
When i look at the last daily candle and it's red, does it mean that i should prefer to look for short setups today and vice versa ?
{quote} By the look of it your DOTS opens at Midnight - check in the settings for the DOTS indicator - choose the session you want to trade and the levels with then correspond with the preceeding PA for the entry and exit levels provided. My settings were foe the London session, so all the Tokyo channel PA had taken place and the levels shown on my screen shot become the new targets for the period to the NY open. Hope that makes sense. Thanks
Ignored
Thanks mate! I need to read up on the DOTS Pdf. I'm only a London Session trader. Will take a look .Cheers
I have a question about trading away from the daily open, as i read about it several times i think i still did not really understand how it's meant to be done. When i look at the last daily candle and it's red, does it mean that i should prefer to look for short setups today and vice versa ?
Ignored
In the screenshot I just attached the Daily Open is shown by a white dotted line; if a buy signal is setting up above the daily open you trade away from the daily open. If a sell signal is forming above this line and you trade it, you will take a position into the daily open.
Firsts losers of the day, seems I'm going to lose my profits from the other day. Can anybody explain why this was a loser? EUSTX50 H4 {image} I waited to the candle to close above the PAC, guppy was UP, DOTS signal was buy, PA was ok (to my understanding), and TDI was about to cross. I made other two entries with this criteria, and also are losers. {image} The following is not closed, but I'm going to close it before it hits SL, it's clear I made the wrong decision. I entered on the open of the candle that in the end, turned to be a doji. USD/JPY...
Ignored
Mordin,
You want to put the 200 ema/close on your charts
The institutions watch the 200 ema...
If you put the 200 ema on your chart & look at your trade
you were trading right into the 200 ema & it got rejected.
Even tho everything else looked good (the 200 ema is pretty
strong) & the institutions rejected price at that level/location.
All my charts have the 200 ema on them for every time frame.
I just want to know where it's at...it's that important!
{quote} Mordin, You want to put the 200 ema/close on your charts The institutions watch the 200 ema... If you put the 200 ema on your chart & look at your trade you were trading right into the 200 ema & it got rejected. Even tho everything else looked good (the 200 ema is pretty strong) & the institutions rejected price at that level/location. All my charts have the 200 ema on them for every time frame. I just want to know where it's at...it's that important! sj
Ignored
Thank you very much, will add it right now to all my charts!
Had to be me. Someone else might have gotten it wrong.
{quote} In the screenshot I just attached the Daily Open is shown by a white dotted line; if a buy signal is setting up above the daily open you trade away from the daily open. If a sell signal is forming above this line and you trade it, you will take a position into the daily open.
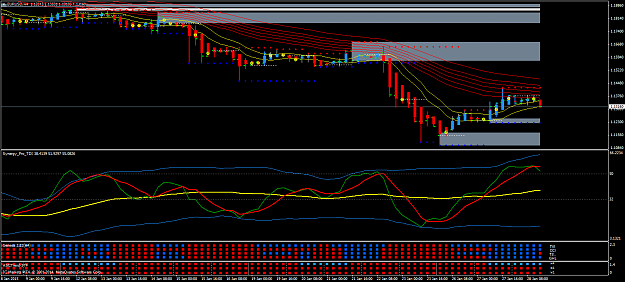
Possible setup forming on EU on 4H? Rejection from Guppies, in line with overall trend: {image}
Ignored
Marinos,
The eur/usd looks good. It looks like the USD
is getting stronger. I have a short position in the
eur/usd (long term trade) & I'm just letting it ride...
It has room to run on the downside.
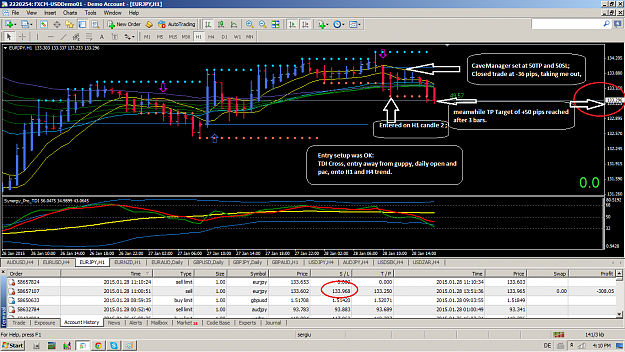
Got in today at EJ H1 on a sell setup checking all 4 criteria.
After order place, CaveManager takes over the trade and rolls with it. SL and TP set at 50, though at candle 3 it takes the SL at -36.3 pips.
3 bars later, TP is hit (as expected from a high probability setup), but my position was hit by the SL 36 by CaveManager.
Are you guys using this tool ?! And why did it take me out at -35 pips - very less space to move and it was within daily range as well. I wouldn't have set a SL so close in any case.
Some feedback on the CaveManager and its suitability for our TMS is welcomed.
SJ, Emmanuel, Got in today at EJ H1 on a sell setup checking all 4 criteria. After order place, CaveManager takes over the trade and rolls with it. SL and TP set at 50, though at candle 3 it takes the SL at -36.3 pips. 3 bars later, TP is hit (as expected from a high probability setup), but my position was hit by the SL 36 by CaveManager. Are you guys using this tool ?! And why did it take me out at -35 pips - very less space to move and it was within daily range as well. I wouldn't have set a SL so close in any case. Some feedback on the CaveManager...
Ignored
Zef,
I don't trade with the cavemanager, so I can't help you with it.
What I wanted to say is, if you add the dsr dynamic s/r level to
your charts you will see their is a lot of room for the e/j to run.
I use the asr/dsr levels as my targets...lot's of room on the downside.
sj