{quote} Nice, I spotted it too but since the TDI was in the "32" area... I didn't trust it too much. Well done dude!
Ignored
I have noticed, that price can still move a really long way while green in oversold/overbought area. So that's not a big thing on H1, i guess, especially when we have strong trend. When we have red or even yellow in that areas - that could really be a strong signal for not entering, especially on H4 or D1. So that's my thoughts
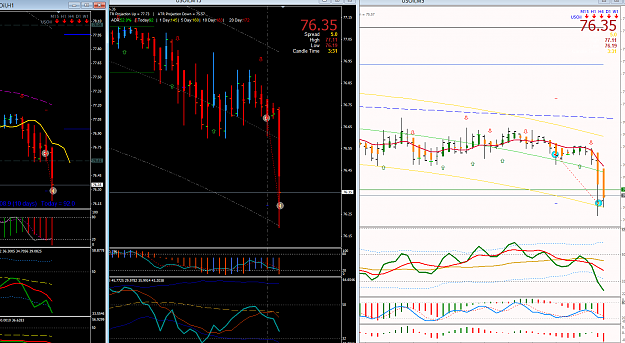
+50 on EA H1 Just look at those LO candles.... Once the direction is confirmed, its like candy from a baby Looks like price will fall further still but I'm happy with 50 for today {image}
Ignored
Great trade !
Took the exact same thing. Again. 3rd day in a row. Best week in TMS so far.
Toledo, you are very right. 30 green phone pips better than nothing !
Sesamstrasse, Nice meeting you! I only trade 5 pairs (eur/usd, gbp/usd, aud/usd, usd/jpy, usd/chf). I'm not sure if those are the best pairs to trade or not but since I live in the USA why not trade those? I trade these pairs on both the 4 hour & daily. What I do is (if you can imagine my screen) is have the top of my screen with these pairs on the daily chart. Then I also have these same pairs on the bottom of my screen with 4 hour charts. I enter a trade on the 4 hour chart. (but watching both the daily & 4 hour chart) if the trade is going my...
{quote} Hey man I am well, not many trades this week though. GJ trailing stop took me out at +7 on monday, and I had a +50 on GU yesterday evening which I will not post because it is not a strictly TMS entry and it will raise too many questions I'm having a look right now I'll just edit this post so I don't double post to answer your question, well I personally like the trades I guess I may have taken them too. The first one is GA I'm assuming and the second usdcad? (still haven't woken up lol) Both are continuing the trend and the TDIs are...
Ignored
Many thanks WDays! The things I feel I must sort out now, which are being discussed is: different versions of the TDI (I'm just using the basic one but there seems to be various spinoffs? I haven't got that yellow line thing), TDI is based on RSI (right?) so when you get the green-red cross is it more probably to get it in over-bought/sold areas (30/70 or 32/68???) and switching b/w TF's as confirmation. Actually a quick glance shows some beautiful trends on the D TF (HA wise that is...)
{quote} I have noticed, that price can still move a really long way while green in oversold/overbought area. So that's not a big thing on H1, i guess, especially when we have strong trend. When we have red or even yellow in that areas - that could really be a strong signal for not entering, especially on H4 or D1. So that's my thoughts ....
Ignored
Intelligent observation, I will keep this in mind ...
from around 50 to 68 ... strong initial long signal over 68 ...still long if trend is strong enough
from around 50 to 32 ... strong initial short signal under 32 ...still short if trend is strong enough
Hi Folks, Trading is visual. What we see shapes our thinking. There is always this never ending questions about H4 chart trading and different brokers server times hence different H4 candles shape and sizes. You can trade just on H1 chart all the time and any time of the day as you are available and comfortable with. Just follow the higher timeframes Weekly and Daily charts. Do your top down analysis to know where major support and resistance were before. Use those Open High Low Close OHLC of the higher TF candles as your natural support and resistance....
Ignored
Hi emmanuel7788, thank you for your post, you cover some very interesting and relevant topics. The first question I have is the 32 and 68 (and 50) don't seem to enter the analysis? Could you expand on this please? Also this TDI uses more lines than the standard does and you seem to use it to gain a better exit - has this improved your outcomes, can you put a % on that (if possible). Actually, I think you are using the originally designed TDI (and not the corrected on by eelfranz?), is that right?
P.s. trading isn't always visual, just talk to the ladder traders... lol
{quote} Intelligent observation, I will keep this in mind ... from around 50 to 68 ... strong initial long signal over 68 ...still long if trend is strong enough from around 50 to 32 ... strong initial short signal under 32 ...still short if trend is strong enough This, is pretty much the idea I have now ...
Ignored
Thanks guys, this is the same idea when trading RSI (right?) PA can stay over-bought/sold for a long time, no problem. So, with TDI are you saying we can trade the cross in either case - what about when crossing the 50 - is this more stronger signal?
When you are trading, I would suggest that once you are in a trade, check your trade every hour on the hourly or every 4 hour on the 4 hour, not in between!!
It's a simple system so don't over complicate it... If you are not confident to do this open a demo account and try it, what I used to do was watch the charts very minute and once price pulled back and I think its going the other way I would close just to find it then come back the way I was in!
Trading will become easier if you are checking you trades and set-up only at the close of the candle!!
GL
Give yourself a chance and trade it like it's layed out...
{quote} Thanks guys, this is the same idea when trading RSI (right?) PA can stay over-bought/sold for a long time, no problem. So, with TDI are you saying we can trade the cross in either case - what about when crossing the 50 - is this more stronger signal?
Ignored
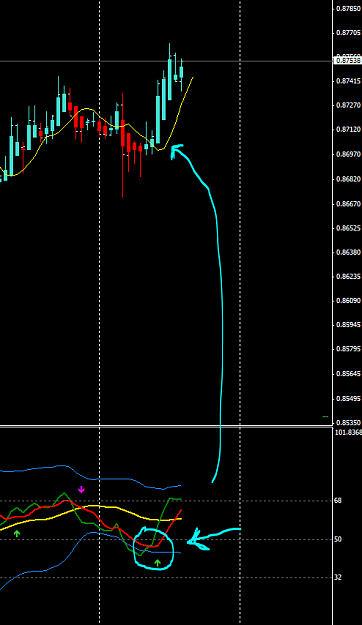
In my humble opinion, it's a super strong signal too, of course supported by the good "steep" angle of TDI (green) and possible also the SignalLine (red)
this below, for example, was a super strong long signal on AUDUSD on H1 chart...
Attached Image (click to enlarge)
It's all a matter of understanding what "a good tdi signal" is ... and i learnt that it's like I wrote before, let's say long from around 45 ---> 68 and short from around 55 --> 32 ... I don't want to confuse you with '45' and '55' but it's to give you an idea...
I'm really liking this system but can someone point me in the direction of the latest indicators and a documented method? It seems to have evolved since post one.
Many thanks.
Nods
Intelligence is the ability to adapt to change. Stephen Hawking
Where I believe a lot of people are finding it hard and wondering which TDI to use is because they are looking at it all the time!! {image} eelfranz show us that we should wait for a candle to close and then look at the TDI... and buy at he open of the candle!! When you are trading, I would suggest that once you are in a trade, check your trade every hour on the hourly or every 4 hour on the 4 hour, not in between!! It's a simple system so don't over complicate it... If you are not confident to do...
Ignored
Thanks Bizzzle! So far, I am using the rules on Post 6 - these don't mention anything more complicated than what you mention but what I would really like to know is has any change to this (not?) improved win% / profit - if so by how much. Of course this could be hard to answer...
{quote} In my humble opinion, it's a super strong signal too, of course supported by the good "steep" angle of TDI (green) and possible also the SignalLine (red) this below, for example, was a super strong long signal on AUDUSD on H1 chart... {image} It's all a matter of understanding what "a good tdi signal" is ... and i learnt that it's like I wrote before, let's say long from around 45 ---> 68 and short from around 55 --> 32 ... I don't want to confuse you with '45' and '55' but it's to give you an idea...
hi ballistical, would u be kind enough to share the green and blue rectangle indicator...will be much appreciated. Rggards
Ignored
Dennis, I'm at work right now, so can't attach them. They've been shared several times. Have a look at Post 41,872 where Likica uploaded them.
You'll probably need to fiddle around with the settings to get the timings right. If you check out the FF home-screen, the correct session timings are in the bottom RH corner of the page.
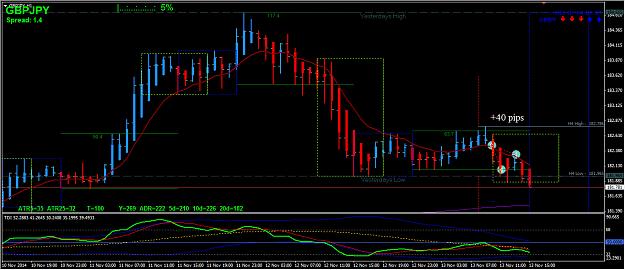
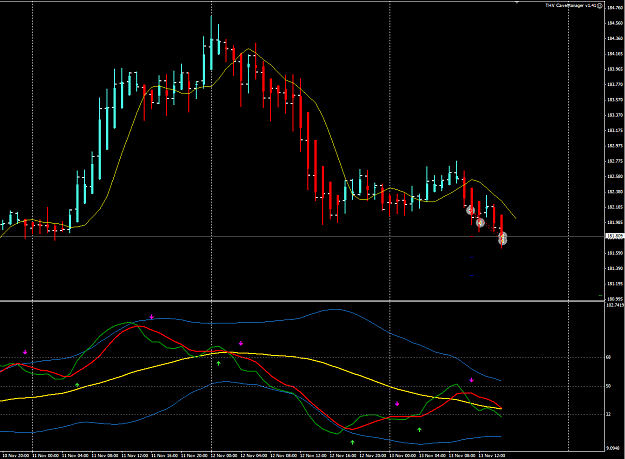
GJ_H1 short at LO, pullback candle and TDI at the time of opening the trade was above MBL but below 50, enough to take the trade following yesterday impulse leg down, closed most of position at +40, let a small one left for more down movement, but trailing stop hit at +12 pips
Attached Image (click to enlarge)
I Have Learned to Take Some Losses to Make Profits
GJ_H1 short at LO, pullback candle and TDI at the time of opening the trade was above MBL but below 50, enough to take the trade following yesterday impulse leg down, closed most of position at +40, let a small one left for more down movement, but trailing stop hit at +12 pips {image}
{quote} Identical trade here around +37 green.... {image}
Ignored
Good one as well, EA was ready too at around LO, see Ballisticall following that pair, the last 3 days LO just sold off that pair, with that knowledge alone you can have an edge the last 3 days on this pair
I Have Learned to Take Some Losses to Make Profits
GBP/JPY? I was in it too, got 45 out of it Not a good feeling to see it turned blue there haha.
Was hoping for 80 pips but I didn't stick to my plan. Bad wolf.
Everything you can imagine, is real - Pablo Picasso