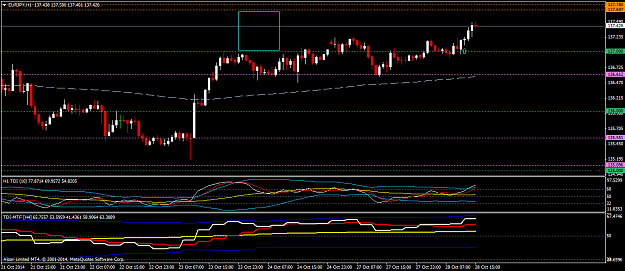
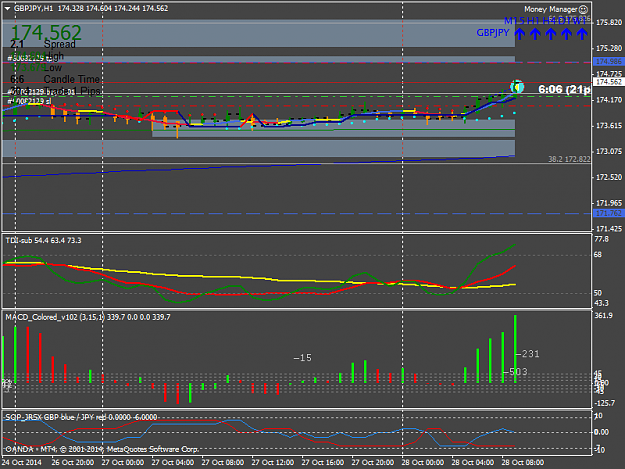
Everything was ok to go long EURJPY with a good space ahead at the arrow on my chart. Though I didn't take it for I was busy with trades that got me BE for today.
Can I get update version of this system? I just got download indicators from PAGE 11, Post#156. Its 3 year OLD post! Now I am wondering how can I setup my first trade entry and exit with system. Please kindly let me know rules so I will apply and post results here. I hope we will make good pips with this simple method. Thanks. Umee
{quote} There are no newest indicator, everything's the same - TDI, Synergy APB are your key indicators the rest is there for flavor. Some of us use the MTF TDI, others use price action either way you can find everything in the paperclip above all the posts, indicators are the same and have the same purpose and you don't need to worry about that Rules for entry and exit are all up to you... You are supposed to make your own conditions for different scenarios. In general, though, long when APB goes blue and the TDI lines go green over red and...
{quote} Everything was ok to go long EURJPY with a good space ahead at the arrow on my chart. Though I didn't take it for I was busy with trades that got me BE for today. {image}
Ignored
GJ was better... I hadn't traded EJ forever, don't know why I chose it instead of GJ tbh... 40 pip TP
Can I get update version of this system? I just got download indicators from PAGE 11, Post#156. Its 3 year OLD post! Now I am wondering how can I setup my first trade entry and exit with system. Please kindly let me know rules so I will apply and post results here. I hope we will make good pips with this simple method. Thanks. Umee
Ignored
Open the TDI in your MetaEditor and read the Info at the beginning. There are entry & exit propositions how to handle it. Preferable on the higher TFs to start with untill you got more convinced.
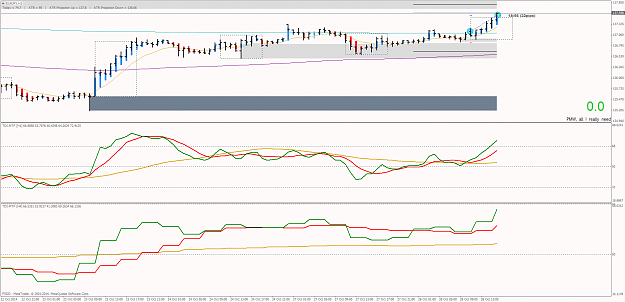
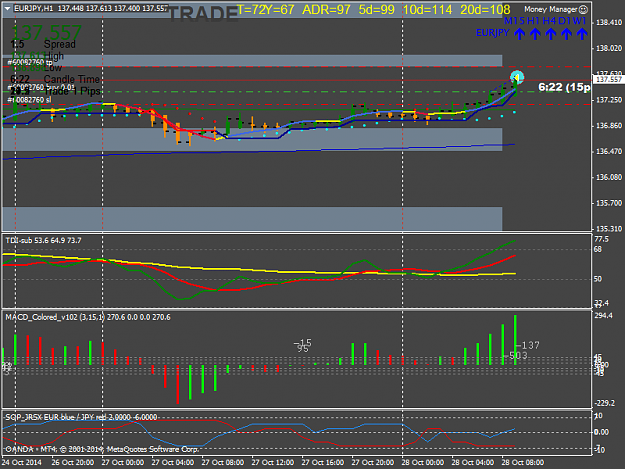
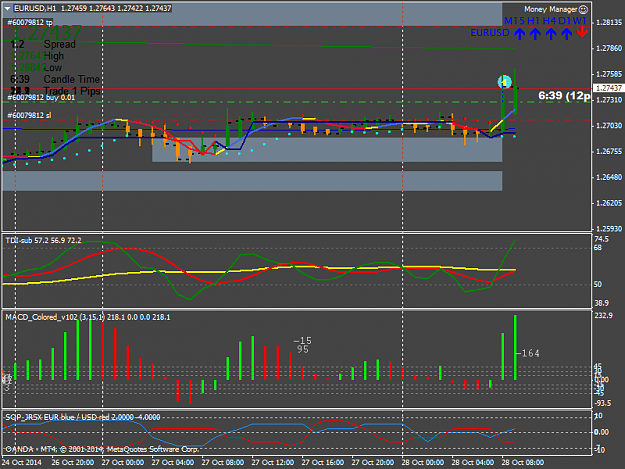
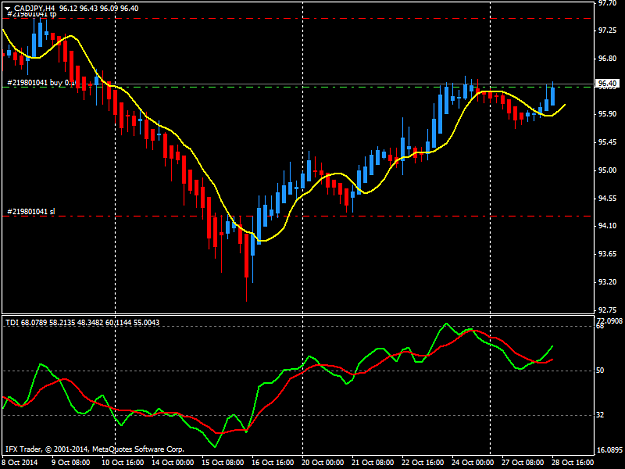
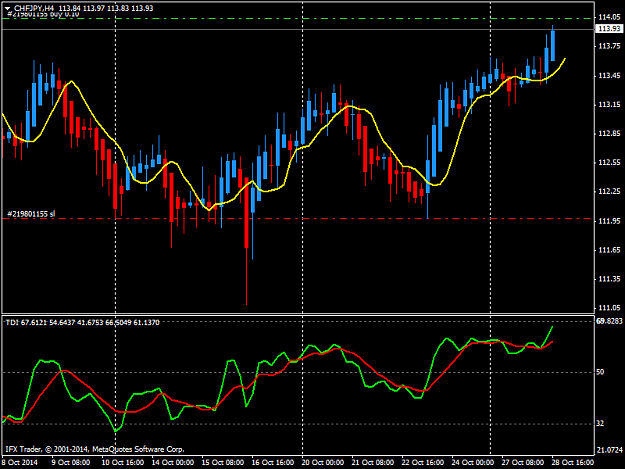
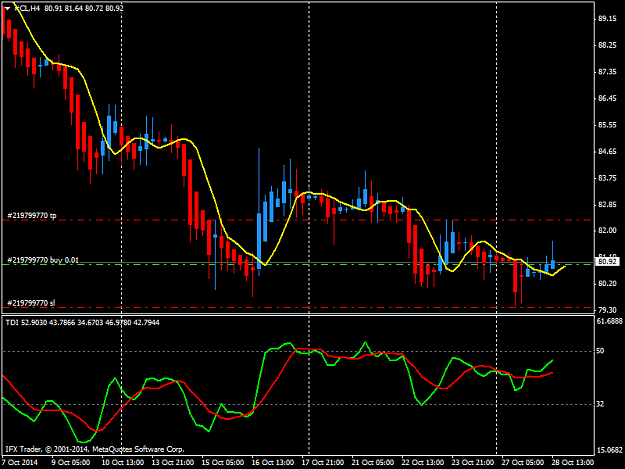
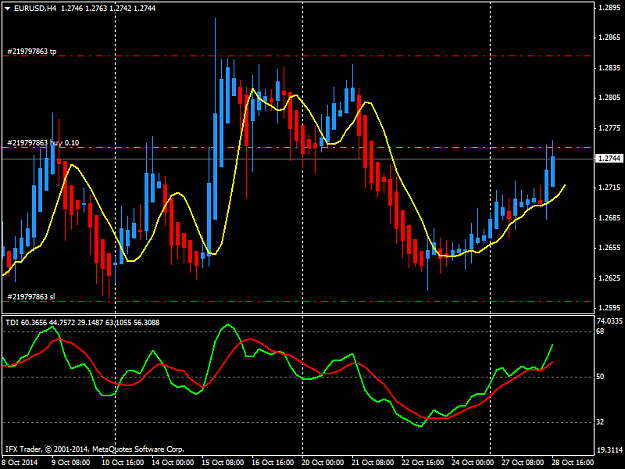
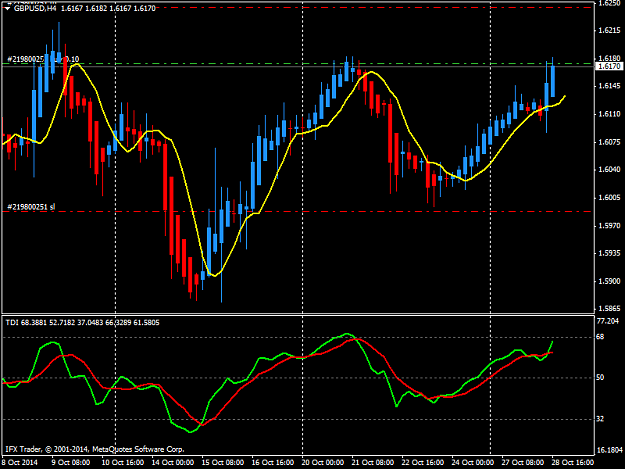
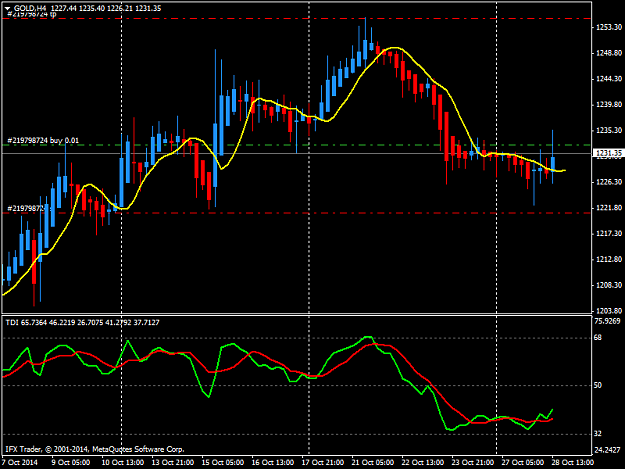
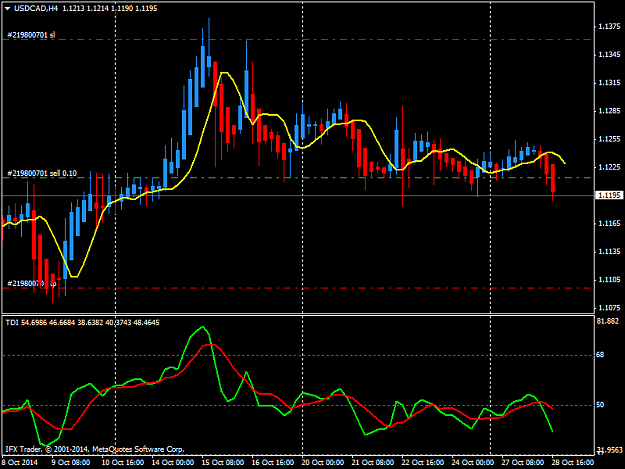
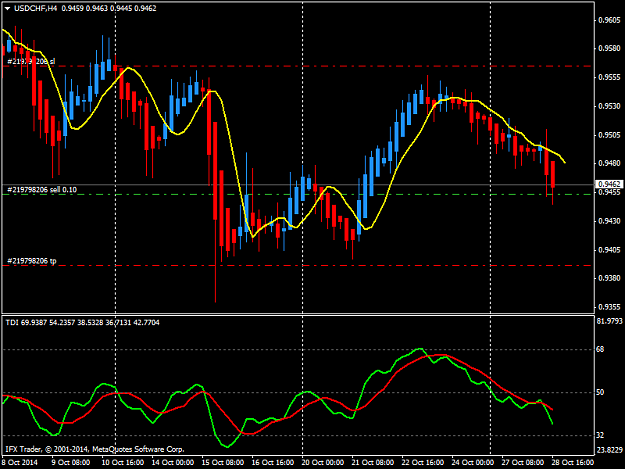
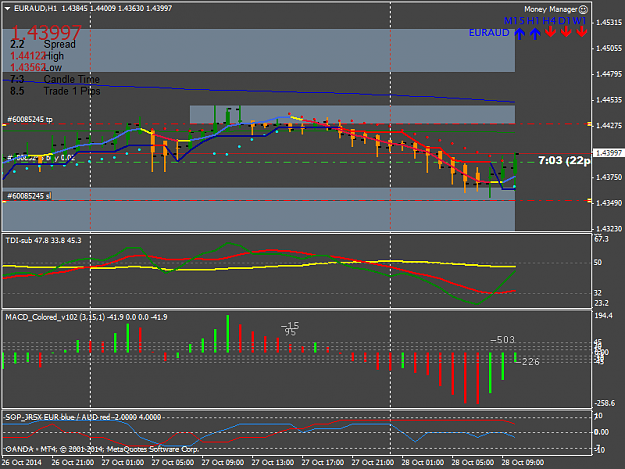
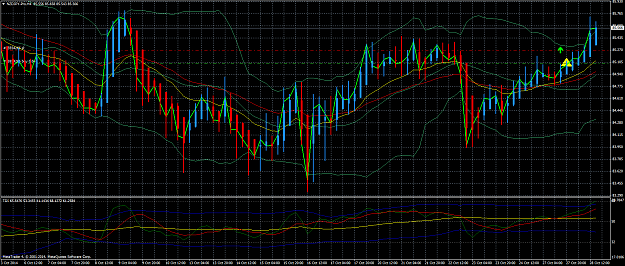
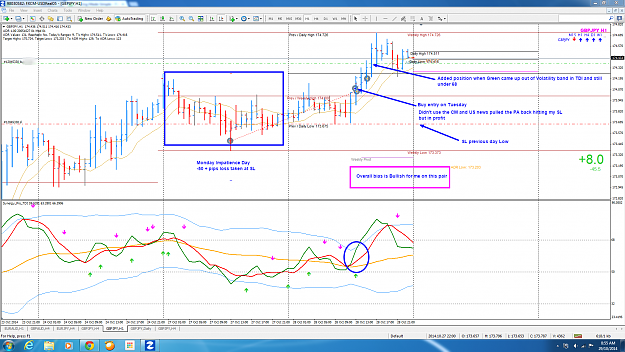
{quote} Okay I have take some entries here, please kindly check... Is it okay? {image} {image} {image} {image} {image} {image} {image} {image} These are my first attempted with this system. Please also let me know if I am missing any indicator or important part in this strategy. Thanks. Umee
Ignored
The CADJPY seems decent, be careful you might experience some drawdown because you bought into resistance (last structure high is a dozen candles away)
The CHFJPY I would have taken on the close of the previous blue candle but direction-wise, it seems good to me, price broke a downtrend trendline, made a higher low..
The third I'd be reluctant to take, PA seems a little choppy, not something I'd trade...
The EURUSD and GBPUSD longs, I'd be careful with. Dollars can be a bit crazy this week.
Gold is also kind of messy and choppy too much for my liking at least.
USDCAD looks good to me, except mind your targets, it may take a long while for it to reach that TP.
USDCHF was sold into support (200EMA in there).
Might I suggest you take 1 trade per session instead of having so many trades to monitor and manage? It would be best if you picked 1 pair and stuck to it until you're well practiced Also sometimes your stop is like 200 pips away, which is not needed, try using the most recent swings.
Best advice I could give you is play around with it on demo, until you know what kind of entries you are looking for. Bizzle can be of great help to you, since he also trades H4.
{quote} Okay I have take some entries here, please kindly check... Is it okay? {image} {image} {image} {image} {image} {image} {image} {image} These are my first attempted with this system. Please also let me know if I am missing any indicator or important part in this strategy. Thanks. Umee
Ignored
Chart 1 and 3 look quite good. Goldchart looks also good,but not sure if the prinzip works for commodities.
Other Charts not so good, cause u jump on trends which are ongoing allready for quite some time.
Basicly wait for the TDIcross and the close of the actual candle.
Big E also said not to enter long when the TSL is close to 68 , and not short when TSL is close to 32.
I d also suggest you to make the Market Base Line appear in your indi-window.
|
Joined Oct 2014
|
Status: Trend Trader!
|339 Posts
@WDays, Thanks for advices!
What do you mean by this? And how do find resistance?
Quote
Disliked
The CADJPY seems decent, be careful you might experience some drawdown because you bought into resistance (last structure high is a dozen candles away).
What does that mean?
Quote
Disliked
The third I'd be reluctant to take, PA seems a little choppy, not something I'd trade...
@Ollisen, Thanks for your support! Now I always remember this point:
Quote
Disliked
Big E also said not to enter long when the TSL is close to 68 , and not short when TSL is close to 32.
I didn't understand this advice?
Quote
Disliked
I d also suggest you to make the Market Base Line appear in your indi-window.
One more thing I want to mentioned here, I found this advice on PDF guide:
We enter a trade when green crosses red on the TDI at the beginning of the new candle... usually candle 1 or 2. If It's candle 3 or more (as in the third bull candle in up move and third bear candle in down move) DONT ENTER ...
Quote
Disliked
Other Charts not so good, cause u jump on trends which are ongoing allready for quite some time.
[quote=umairsheikh2;7829125] I didn't understand this advice? {quote}
Open TDI in MetaEditor. Watch line 88. "#property indicator_color3 0xFFFFFFFF // Yellow". Change the line to be like that :"#property indicator_color3 Yellow"
Save the file and compile it. Now the Market Base Line should appear as a yellow line in your indicator-window.
A Note in the TDI says :Active - Long = Green over Red & Yellow lines --- Short = Red over Green & Yellow lines.
Hope that helps you a bit.
@WDays, Thanks for advices! What do you mean by this? And how do find resistance? {quote} What does that mean? {quote} @Ollisen, Thanks for your support! Now I always remember this point: {quote} I didn't understand this advice? {quote} One more thing I want to mentioned here, I found this advice on PDF guide: We enter a trade when green crosses red on the TDI at the beginning of the new candle... usually candle 1 or 2. If It's candle 3 or more (as in the third bull candle in up move and third bear candle in down move) DONT ENTER ... {quote}
Ignored
www.babypips.com/school has some good information on Support and Resistance levels. Choppy price action generally means that the pair has no direction, but randomly moves up and down in little time, thus printing bars with long wicks and confusing traders If I want to trade a market that has been consolidating, it's not enough to see a momentum candle, I want a break of structure (wedges, pennants, triangles etc.) and most of all I want the higher timeframe to be hinting towards new movements.
The rule about entering on candle #1 or candle #2 basically means that most times price will move in one direction for at least 3 candles, sometimes more (up to 8) before it changes direction. The idea here is that by entering on a third or latter candle, you may be trying to ride a move that is already exhausted, and you're in for a lot of drawdown. What I've found best for myself (and others have so too) is to enter with a price action candle. I like engulfing patterns, inside bars and pins best.
I didn't understand this advice? {quote} Open TDI in MetaEditor. Watch line 88. "#property indicator_color3 0xFFFFFFFF // Yellow". Change the line to be like that :"#property indicator_color3 Yellow" Save the file and compile it. Now the Market Base Line should appear as a yellow line in your indicator-window. A Note in the TDI says :Active - Long = Green over Red & Yellow lines --- Short = Red over Green & Yellow lines. Hope that helps you a bit.
Ignored
Thanks again but I cannot edit this indicator because I have ex4 file. If you have MQ4 file for this indicator please let me know. So I will make changes according to you or you can also made changes and give me indi.
{quote} www.babypips.com/school has some good information on Support and Resistance levels. Choppy price action generally means that the pair has no direction, but randomly moves up and down in little time, thus printing bars with long wicks and confusing traders If I want to trade a market that has been consolidating, it's not enough to see a momentum candle, I want a break of structure (wedges, pennants, triangles etc.) and most of all I want the higher timeframe to be hinting towards new movements....
Ignored
Thanks for info! What do you think if we will add pivot, support and resistance point with any indi? Its gives us more leverage and better direction.
{quote} Thanks again but I cannot edit this indicator because I have ex4 file. If you have MQ4 file for this indicator please let me know. So I will make changes according to you or you can also made changes and give me indi. {quote} Thanks for info! What do you think if we will add pivot, support and resistance point with any indi? Its gives us more leverage and better direction.
Ignored
I don't use pivots. They're nothing more than another type of S/R. I have used them in the past, back in my genesis matrix trading days... but nowadays I don't find them useful anymore have a read on S/R levels in babypips, keep in mind most recent structure has the highest impact on price and that's all you'll need
Yes I back-tested it on Gold and Oil and it should work also on indices and any instrument that most of the time trade strongly in one direction and with high daily range.