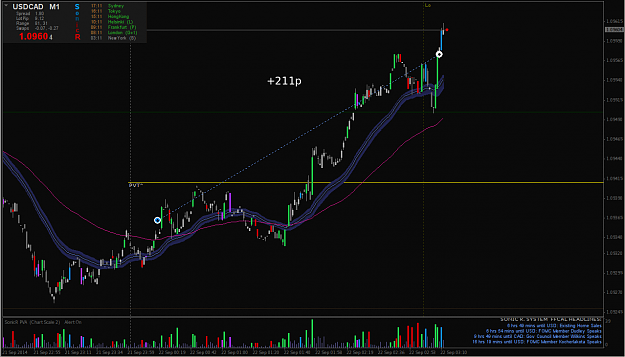
Long-term analysis on USDCAD:
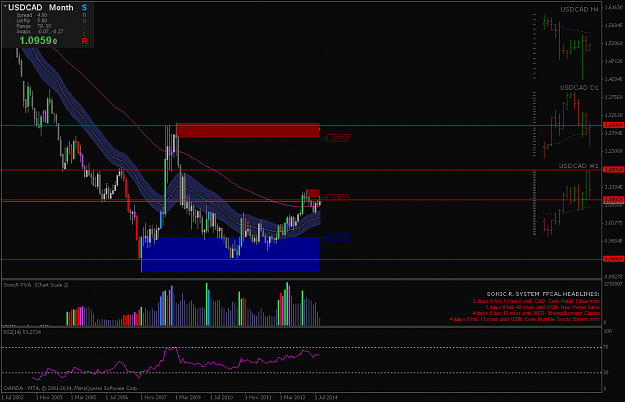
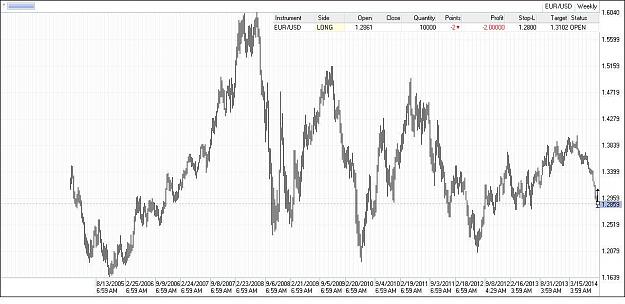
On the below Monthly chart we can see a Double-Bottom at the 0.94000 level with what looks to be some pretty serious buying volume. Price then started to stair-step upwards, with the Dragon also pointing up. If price pushes up above 1.1000 it could go up as far as 1.3000, but will need to breakthrough resistance at 1.8000 to do so.
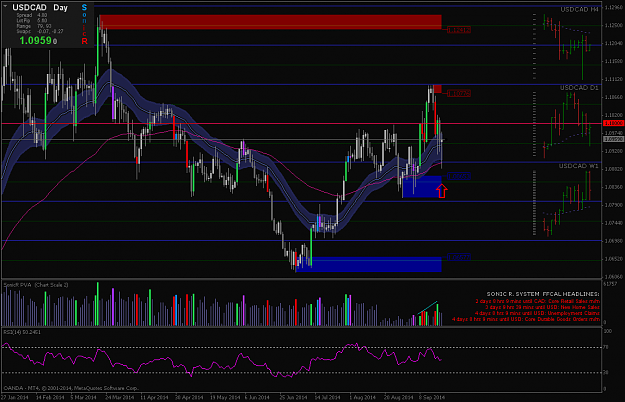
Zooming into the Daily chart we can see a retracement back to the Dragon, accompanied by a bullish pinbar.
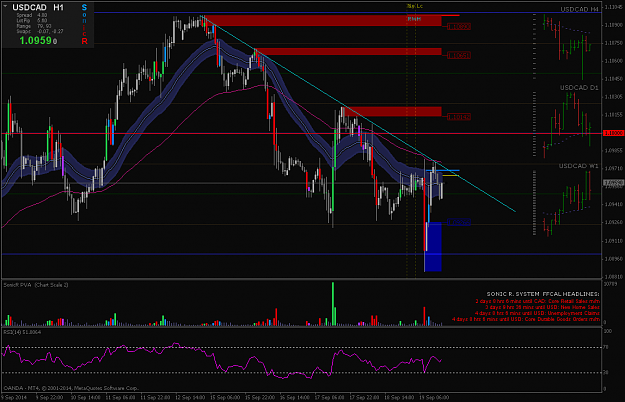
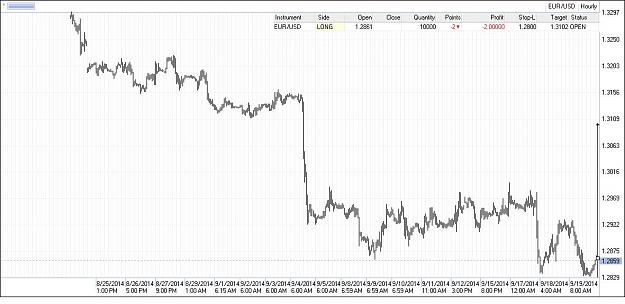
Moving onto the Hourly chart we can see that the downtrend has, for now, bounced off the 1.0900 level, but met resistance at the RWL and downward trendline.
If my bullish bias is correct I'll be looking for entry at a break above the trendline with a scout, re-entry with another scout if the trendline acts as support, and if and when price breaks above 1.1000 a Classic setup (or numerous Classic entries) should've have presented itself by then for confirmation.
Now let's see if the market acts out it's role in the above script...
