Joined May 2014
|
Status: Full Time Trader
|27,148 Posts
Fdax
IMO there will be a sideways flag soon.. scalpers will trade the up and downs. Since its Friday I really feel lazy to scalp today. Will watch others how they will surf with the waves
{image} not that i have to proof something - it´s just the pa that made me entering the market... edit: had to set that sl =-18 points, minimum intevall atm with my broker. will close it manually if -10 is reached.
Joined May 2014
|
Status: Full Time Trader
|27,148 Posts
Fdax 1H
I re-checked my view.. so things are very different for me now..
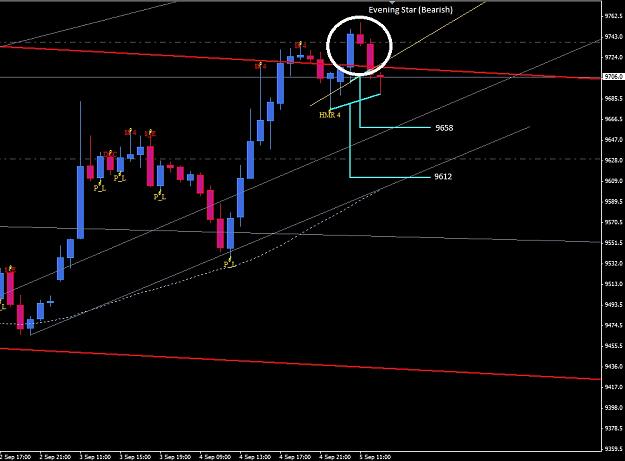
If price doesn't climb back over the golden line my next 2 bearish targets are stated in the picture below. If price climbs back up above the golden line we must think long again.
{quote} If UK and Germany follow Hong Kong and China we could see quite a bit more of gains to come. China and Hong Kong had one hell of a pop today and Japan held their previous gains followed by more small gains today. US futures are up too. I got a feeling that SPX500 2007 that it will head for 2020 next I got a feeling that this week will be another good day to short on Thursday for a good roller coaster ride or Friday for profit booking.
Ignored
Like clock work. Roller coaster day on Thursday with either big gains followed by big losses or a big drop followed by a big rebound and then profit taking on Friday.
Fdax 1H I re-checked my view.. so things are very different for me now.. If price doesn't climb back over the golden line my next 2 bearish targets are stated in the picture below. If price climbs back up above the golden line we must think long again. Happy Trades {image}
Ignored
Stuck in the middl right now. Too risky to trade either way. If it was oversold I would buy and it if it were overbought I would short it. Right no none of this happened. Euro was a better trade earlier on as it was oversold.
{quote} Stuck in the middl right now. Too risky to trade either way. If it was oversold I would buy and it if it were overbought I would short it. Right no none of this happened. Euro was a better trade earlier on as it was oversold.
Ignored
Hi Buddy, well if you feel blind and don't know where to go the very first thing to do is to look if price is above or under 50 sma on the chart you are using.. above means we are still bullish and under means we are bearish.. it acts like a torch in darkness
{quote} Hi Buddy, well if you feel blind and don't know where to go the very first thing to do is to look if price is above or under 50 sma on the chart you are using.. above means we are still bullish and under means we are bearish.. it acts like a torch in darkness Happy Trades
On any TF.. it doesn't matter.. but the effect will be weaker the shorter TFs you use.
Let me explain:
I am, for example, a 1H trader. So the overall trend for me is the sma50 on 1H. If price there is above then I think bullish. If not then bearish. Sometimes when market is slow, then I go to one level shorter TF the 15m. There I maybe can get an earlier signal of a possible price change. But of course I don't rely fully on this. It's just like a double check.
Fdax 1H I re-checked my view.. so things are very different for me now.. If price doesn't climb back over the golden line my next 2 bearish targets are stated in the picture below. If price climbs back up above the golden line we must think long again. Happy Trades {image}
Ignored
Hello,
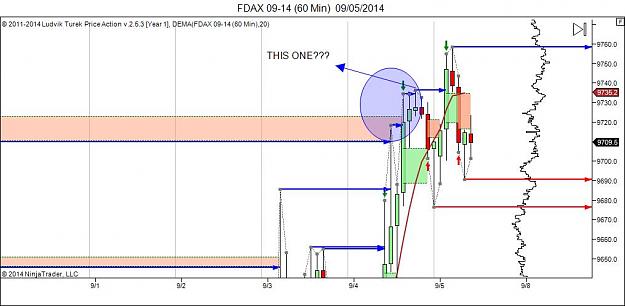
when I look at Your chart, what do U think about the day before, at 7pm..do You consider it as DOJI or small evening star as well??
George Soros has a huge short amount on the market since last year. For the last year he has been wrong. His bet now is over $2 Billion while Morgan Stanley is calling for the S&P500 to possibly run to 3000
{quote} Hi Buddy, well if you feel blind and don't know where to go the very first thing to do is to look if price is above or under 50 sma on the chart you are using.. above means we are still bullish and under means we are bearish.. it acts like a torch in darkness Happy Trades
Ignored
I would use the 50 SMA during high or lows of the day and not while it is in the middle on a Friday with options expiring to where it could be lifted up really quick or dumped really quick.
{quote} Hello, when I look at Your chart, what do U think about the day before, at 7pm..do You consider it as DOJI or small evening star as well?? {image}
{quote} I would use the 50 SMA during high or lows of the day and not while it is in the middle on a Friday with options expiring to where it could be lifted up really quick or dumped really quick.
Ignored
Good idea again I don't solely rely on it so of course you may use it the way it suits your trading style.
Happy Trades
Ignored