After a long long time looking at and studying a lot of material about basket trading what I strongly recommend all people to do: at least
don't only read this thread, also look for T101, EStrader and Kosomolate profiles and read the threads the have started/commented for a
complete and better understanding of the way a basket can move and what is the difference between a correlated basket, a pair group and a
hedge basket, which can look like similar concepts but, in the practice, are completely different.
As the more used concept in this thread is the pair groups, I'll try to adapt what I want to show you to it to make something about general
interest.
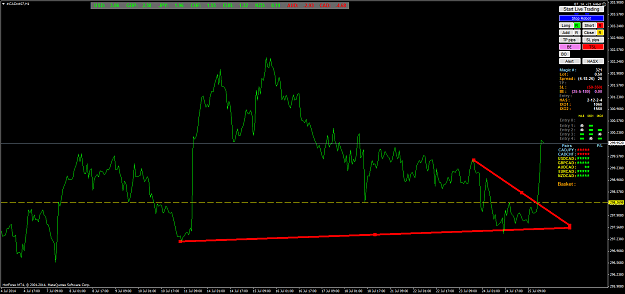
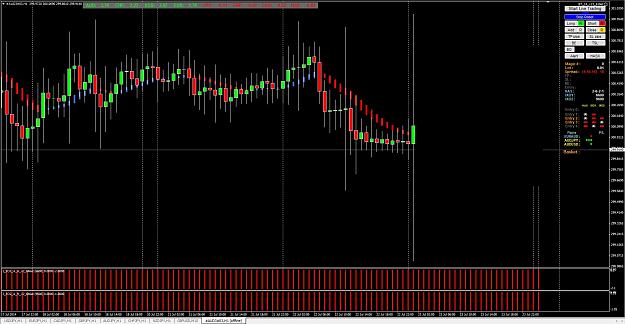
Some time ago, seller9 shared this picture with us.
He said that the JPY were the strongest currency (and it's true) and as a cause of that, he wanted to buy JPY group and, from my point of view, that was a little mistake.
Let me explain it.
Let's think about a pair, as we know (or should know, at least) when we are buying a pair, we are not buying the two currencies in that pair,
we are buying one of them and selling the other one at the same time (one of the basic concepts in forex). This pair can be called, for
example, AB, where A is a currency and B is another one. In this position, when we are buying the AB pair, we are really buying the A
currency and selling B, and viceversa when we sell that pair. Let's try to extrapolate this idea to the currency meter that seller9 pointed
at: you have some strong currencies (on green) and some weak ones (on read), as people usually call them. I think these "adjectives" are
completely wrong, because by the way they're calculated, the green ones trend to be "buying currencies" and the red ones trend to be "selling currencies" (as always, remember that, with the majority of indicators we are looking at the past) so the biggest positive number on green is going to correspond to a currency (remember, a currency, not a pair) who has been recently buyed a lot (a strong buy)and the biggest negative number on red is going to correspond to a sold currency (strong sell).
Let's think again on AB pairs. It's clear that if the trend is up and we BUY, we buy A currency and sell B currency. When can happen this?
Well, it can happens when one of the two currencies (A or B) is stronger than the other one. And thinking it in a mathemathical and logical
way we have two cases:
-A currency is one of the green ones with the biggest positive number.
or
-B currency is one of the red ones with the biggest negative number.
If we SELL, the situation would look in a oppossite way:
-A currency is one of the red ones with the biggest negative number.
or
-B currency is one of the green ones with the biggest positive number.
But we should look at the absolute value of the numbers, too, because a value of -3 is stronger than 0,03, even if 0,03 is positive. You can
think in the strenght like when there are people pulling a rope on both ends, as they are pulling ones against others, strenght is positive
in one side and negative in the other side, so which side wins? the one with a bigger absolute value of strenght.
In resume, to know where a pair is trending, I look to the currency strenght meter and follow these steps:
1. Look for the biggest number in the table in absolute value (we don`t mind if it is positive or negative, because if it's the biggest one, it rules over the rest of pairs).
2. Look at the pairs of the group you can form with that currency:
- If the currency is POSITIVE and it is the A of an AB pair, the trend is UP; if it is the B of an AB pair, the trend is DOWN.
- If the currency is NEGATIVE and it is the A of an AB pair, the trend is DoWN; if it is the B, the trend is UP.
That it's what were wrong, from my point of view, in the last picture: yes, the JPY were the strongest currency, in positive, but that means
that the JPY was going up, if you stop a moment and look at the JPY group: AUDJPY, CADJPY, EURJPY, ... the JPY is always on second position
(is the B of an AB pair), what means that if you buy the entire group, you are at the same time selling the JPY, against the recommendation
of the currency strenght meter. I think in this example you were lucky and get a little retracement of the principal trend, which was clearly
bearish.
On other hand, we must remember that the currency strenght meter doesn't look the same in different timeframes, it gives you information
about how has been moving the price in the recent past in every timeframe. That's why, after doing a lot of research, and using this information to trade I would strongly reccomend to use H1 and H4 in accordance.
If we could automate this and get the info on M15 in accordance with H1 and H4, we would even support less than 5 pips of drawdown per pair (on average...and yes I have calculated the average after hours and hours in front of the screen ) but doing it on manually is too hard
and requires lots of time at the fron of the screen, as I've said. So, instead of it, use the accordance between H1 and H4 at the open hour
of Tokyo, London and New York markets and you will get the best results. Just trade the pair group of the strongest currency in the direction
the strenght meter is telling you (if applied correctly) and manage the basket with seller9 EA. You can even just put standard settings to
the indis in seller9 EA and with the buttons, make the EA just take buy orders (if the trend is bullish) or sell orders (if the trend is bearish) to limit the drawdown.
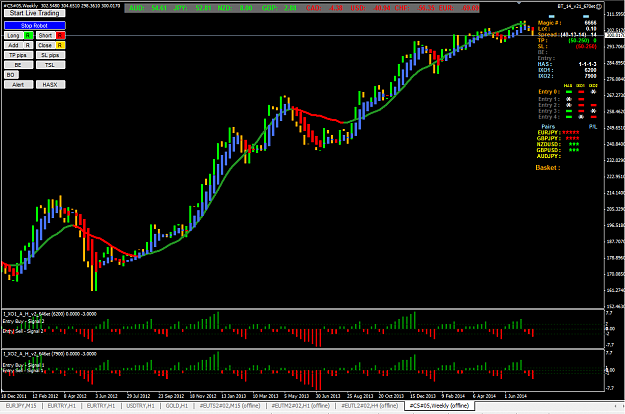
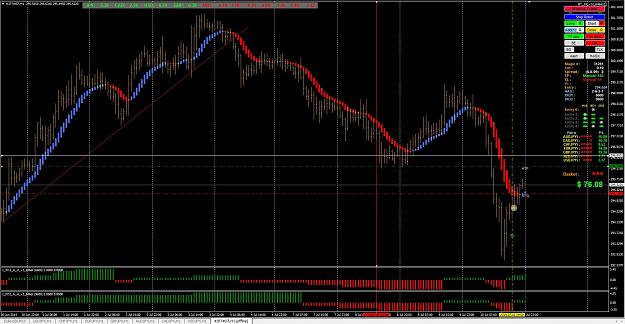
In order to compare H1 and H4 I usually have always a chart opened for both timeframes (one for each one, of course) with seller9 EA, just to take the numbers and compare them.
Finally, I really expect and hope this information can be interesting for some people. My apologies for writing so much (it's hard to me writing something in English, as I can't say always what I want exactly to say and have to look for alternative words). I really really don't want to disturb anybody.
As always, thanks to seller9 for a wonderful EA and a limitless patience with all of us.
Regards and best wishes.
Casyo.
don't only read this thread, also look for T101, EStrader and Kosomolate profiles and read the threads the have started/commented for a
complete and better understanding of the way a basket can move and what is the difference between a correlated basket, a pair group and a
hedge basket, which can look like similar concepts but, in the practice, are completely different.
As the more used concept in this thread is the pair groups, I'll try to adapt what I want to show you to it to make something about general
interest.
Some time ago, seller9 shared this picture with us.
Attached Image (click to enlarge)
He said that the JPY were the strongest currency (and it's true) and as a cause of that, he wanted to buy JPY group and, from my point of view, that was a little mistake.
Let me explain it.
Let's think about a pair, as we know (or should know, at least) when we are buying a pair, we are not buying the two currencies in that pair,
we are buying one of them and selling the other one at the same time (one of the basic concepts in forex). This pair can be called, for
example, AB, where A is a currency and B is another one. In this position, when we are buying the AB pair, we are really buying the A
currency and selling B, and viceversa when we sell that pair. Let's try to extrapolate this idea to the currency meter that seller9 pointed
at: you have some strong currencies (on green) and some weak ones (on read), as people usually call them. I think these "adjectives" are
completely wrong, because by the way they're calculated, the green ones trend to be "buying currencies" and the red ones trend to be "selling currencies" (as always, remember that, with the majority of indicators we are looking at the past) so the biggest positive number on green is going to correspond to a currency (remember, a currency, not a pair) who has been recently buyed a lot (a strong buy)and the biggest negative number on red is going to correspond to a sold currency (strong sell).
Let's think again on AB pairs. It's clear that if the trend is up and we BUY, we buy A currency and sell B currency. When can happen this?
Well, it can happens when one of the two currencies (A or B) is stronger than the other one. And thinking it in a mathemathical and logical
way we have two cases:
-A currency is one of the green ones with the biggest positive number.
or
-B currency is one of the red ones with the biggest negative number.
If we SELL, the situation would look in a oppossite way:
-A currency is one of the red ones with the biggest negative number.
or
-B currency is one of the green ones with the biggest positive number.
But we should look at the absolute value of the numbers, too, because a value of -3 is stronger than 0,03, even if 0,03 is positive. You can
think in the strenght like when there are people pulling a rope on both ends, as they are pulling ones against others, strenght is positive
in one side and negative in the other side, so which side wins? the one with a bigger absolute value of strenght.
In resume, to know where a pair is trending, I look to the currency strenght meter and follow these steps:
1. Look for the biggest number in the table in absolute value (we don`t mind if it is positive or negative, because if it's the biggest one, it rules over the rest of pairs).
2. Look at the pairs of the group you can form with that currency:
- If the currency is POSITIVE and it is the A of an AB pair, the trend is UP; if it is the B of an AB pair, the trend is DOWN.
- If the currency is NEGATIVE and it is the A of an AB pair, the trend is DoWN; if it is the B, the trend is UP.
That it's what were wrong, from my point of view, in the last picture: yes, the JPY were the strongest currency, in positive, but that means
that the JPY was going up, if you stop a moment and look at the JPY group: AUDJPY, CADJPY, EURJPY, ... the JPY is always on second position
(is the B of an AB pair), what means that if you buy the entire group, you are at the same time selling the JPY, against the recommendation
of the currency strenght meter. I think in this example you were lucky and get a little retracement of the principal trend, which was clearly
bearish.
On other hand, we must remember that the currency strenght meter doesn't look the same in different timeframes, it gives you information
about how has been moving the price in the recent past in every timeframe. That's why, after doing a lot of research, and using this information to trade I would strongly reccomend to use H1 and H4 in accordance.
If we could automate this and get the info on M15 in accordance with H1 and H4, we would even support less than 5 pips of drawdown per pair (on average...and yes I have calculated the average after hours and hours in front of the screen
and requires lots of time at the fron of the screen, as I've said. So, instead of it, use the accordance between H1 and H4 at the open hour
of Tokyo, London and New York markets and you will get the best results. Just trade the pair group of the strongest currency in the direction
the strenght meter is telling you (if applied correctly) and manage the basket with seller9 EA. You can even just put standard settings to
the indis in seller9 EA and with the buttons, make the EA just take buy orders (if the trend is bullish) or sell orders (if the trend is bearish) to limit the drawdown.
In order to compare H1 and H4 I usually have always a chart opened for both timeframes (one for each one, of course) with seller9 EA, just to take the numbers and compare them.
Finally, I really expect and hope this information can be interesting for some people. My apologies for writing so much (it's hard to me writing something in English, as I can't say always what I want exactly to say and have to look for alternative words). I really really don't want to disturb anybody.
As always, thanks to seller9 for a wonderful EA and a limitless patience with all of us.
Regards and best wishes.
Casyo.