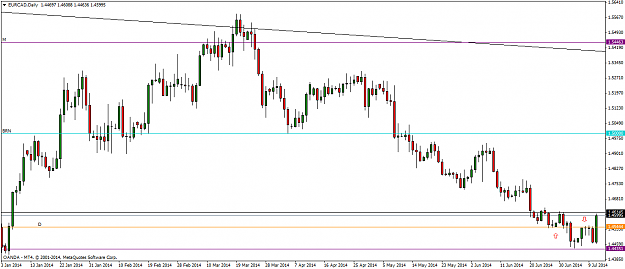
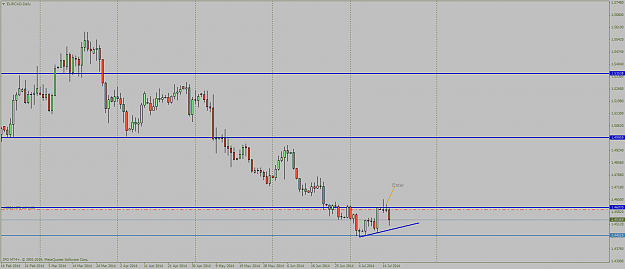
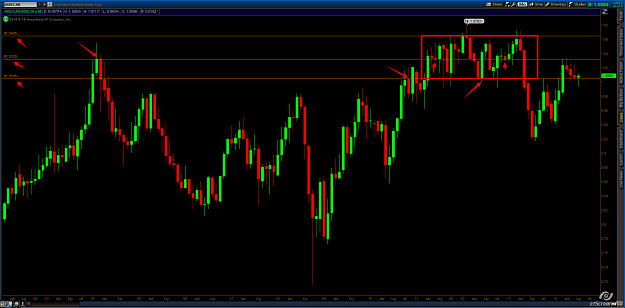
And the 2nd scenario. This is an early entry with closer SL and much bigger profit potential. I would like to hear fxgroup's comments about how valid this entry is
Attached Image (click to enlarge)
Attached Image (click to enlarge)
Attached Image (click to enlarge)