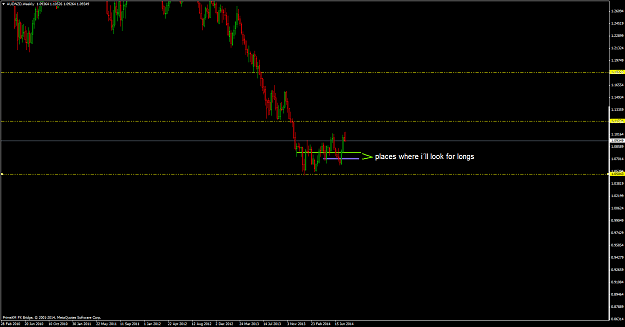
These are my thoughts on AUDNZD, Ponchofx thanks for posting
and as a student of this threath this is my view...
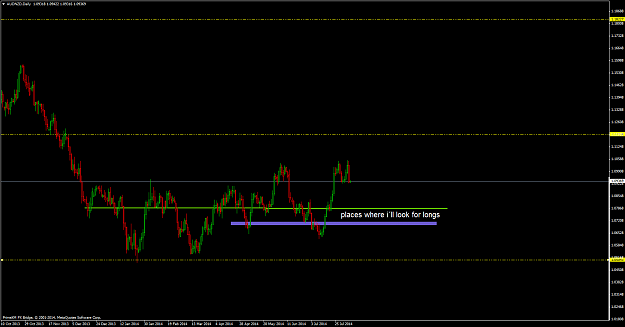
Personally i will look for longs as described on my charts, so i see a retracement back to 1.0798
1.0708 zone but this is just me, normaly market tends to do the opposite
|
Commercial Member
|
Joined Nov 2010
|1,178 Posts
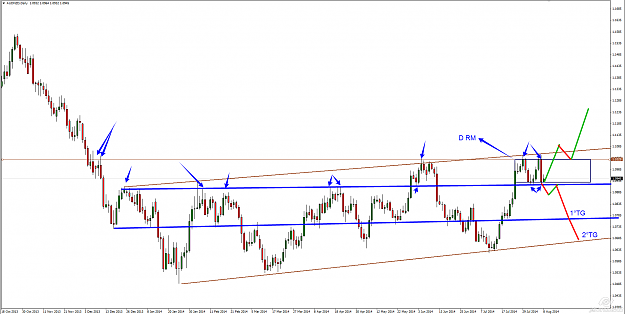
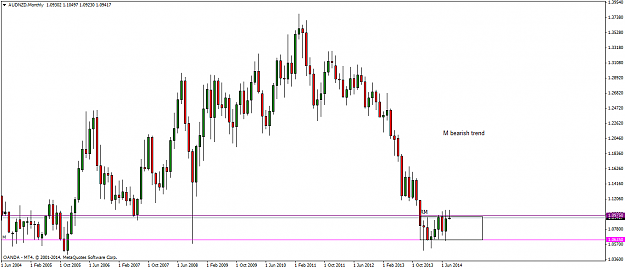
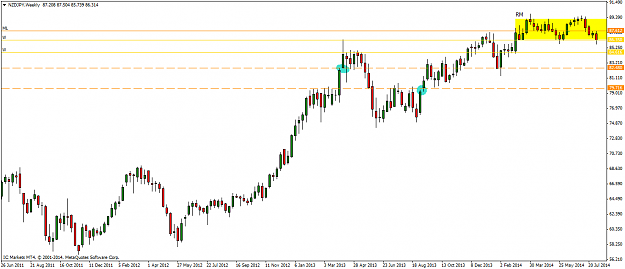
The AUDNZD is in a complicated situation...why this ?!?!
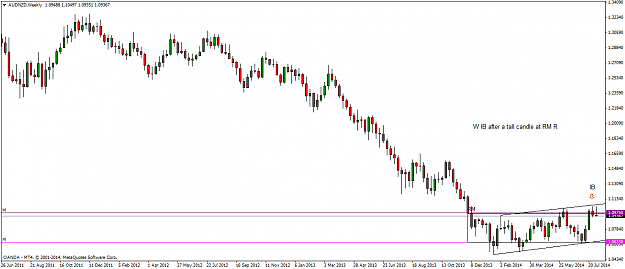
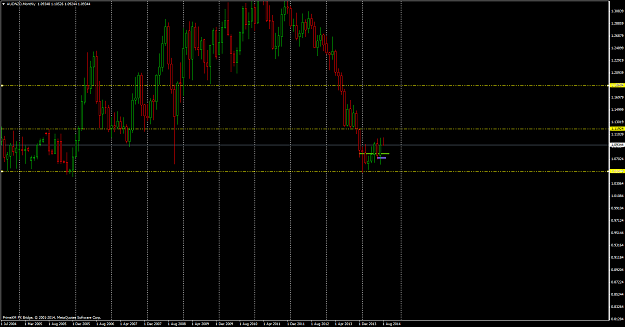
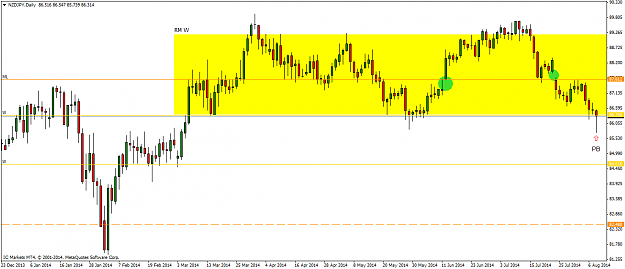
The M chart is doing a RM within a bullish PB as indirected inversion and this a bullish information...BUT..the last M candle closed as an buyers exhaustion, meanwhile the W closed as bearish PB with great problems at its RM's ML ( middle level) ..well spoted by the " thenew "...so...now in the market we have both buyers and sellers !
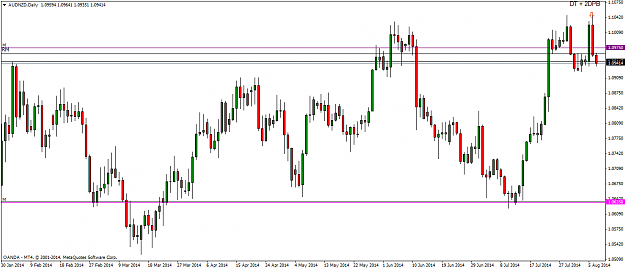
The short positions must be managed into an agressive way putting the trade in safe as soon as possible and I will consider it only if the P will close below the small D RM !
For the long position I will consider only when I will have the confirmation of the 1.1030 as S with 1.12 as final TG !
Fxgroup,
I am sorry if this is a stupid question, Could you explain direct ind indirect inversion, please?
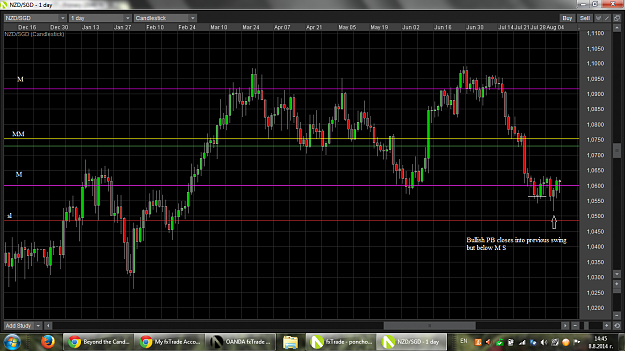
Also on the NZDSGD example is it still OK if the D bullish PB closes below MS or you would wait for the next bar to close above it for more safety
Here is some pairs I find interesting
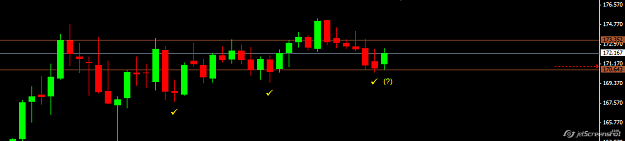
1. NZDJPY
M- up; W- RM; D- PB at RM support
Attached Image (click to enlarge)
Attached Image (click to enlarge)
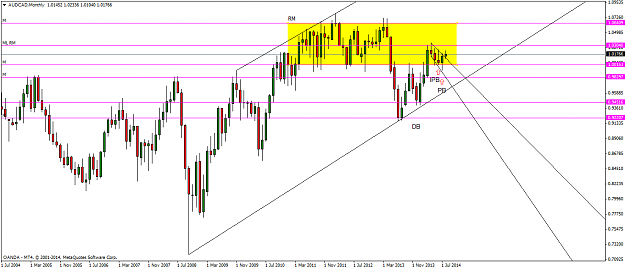
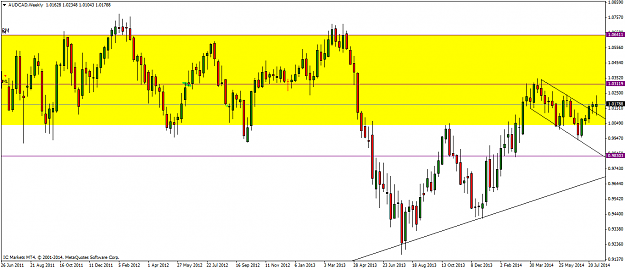
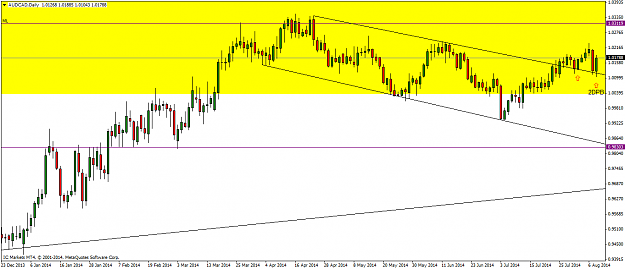
2. AUDCAD
M trend up. DB, there is a close above neckline all the way up the ML of previous RM M. Then RET to the neckline (and 50% of the tall bullish candle) and formed IPB and another bullish PB.
W - P closed above descending TL and then formed bullish PB
D - P RET to TL and made a 2DPB
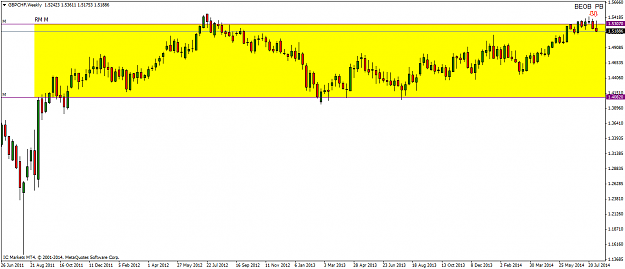
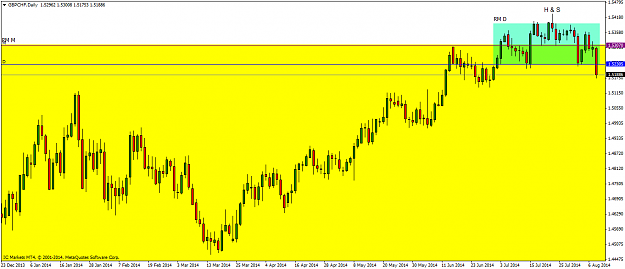
M RM for almost 3 years
W P is at RM R, showing bearish signals
D RM around M level. P has been flipping around M level in a D RM forming a H&S pattern. P broke through and closed below the neckline. I think it's going south but I want to see RET to neckline and confirmation
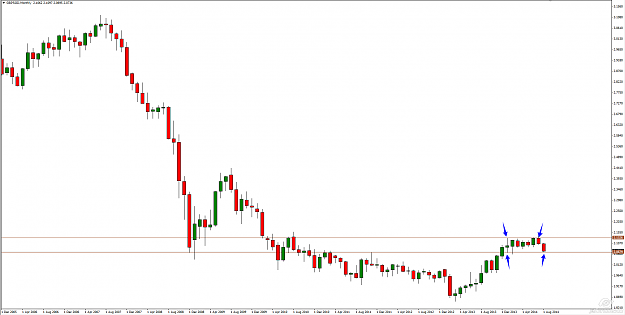
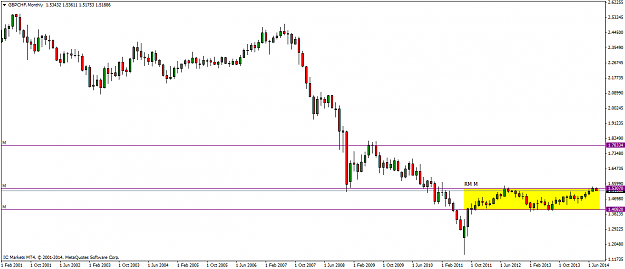
GBPCHF is another one I'm watching closely {image} {image} {image} M RM for almost 3 years W P is at RM R, showing bearish signals D RM around M level. P has been flipping around M level in a D RM forming a H&S pattern. P broke through and closed below the neckline. I think it's going south but I want to see RET to neckline and confirmation
Ignored
Ponchofx, thanks for this awareness and analysis of this pair. I just discovered PA from fxmig and fxgroup threads. Trying to move away from lower timeframe scalping which is very difficult. These posts have opened my eyes to the higher timeframes and i waiting for my first big wave from the D, W or M. Thanks again for posting this example. Many Blessings to you and the above mentioned. Excited that the market is opening today!!! BUT, will be patience.
The AUDNZD is in a complicated situation...why this ?!?! The M chart is doing a RM within a bullish PB as indirected inversion and this a bullish information...BUT..the last M candle closed as an buyers exhaustion, meanwhile the W closed as bearish PB with great problems at its RM's ML ( middle level) ..well spoted by the " thenew "...so...now in the market we have both buyers and sellers ! The short positions must be managed into an agressive way putting the trade in safe as soon as possible and I will consider it only if the P will close below...
Ignored
Hi FXgroup
I see your point about audnzd. I shorted early last week but price action took my stop out only to put a strong reversal the very next day. It left me thinking 'second time lucky?' after it put in another inverse hammer last week
Olu
Find a trend and milk it for all it is worth. That's how to be profitable
{quote} Ponchofx, thanks for this awareness and analysis of this pair. I just discovered PA from fxmig and fxgroup threads. Trying to move away from lower timeframe scalping which is very difficult. These posts have opened my eyes to the higher timeframes and i waiting for my first big wave from the D, W or M. Thanks again for posting this example. Many Blessings to you and the above mentioned. Excited that the market is opening today!!! BUT, will be patience. Thanks for your insight.[/quote]
You're welcome! I'm glad that you find my posts useful. Keep in mind though, that I am also a newbie with this method so my analysis is probably not as perfect and thorough as that of the more experienced traders.
{quote} Hi FXgroup I see your point about audnzd. I shorted early last week but price action took my stop out only to put a strong reversal the very next day. It left me thinking 'second time lucky?' after it put in another inverse hammer last week Olu
Ignored
Hi Olu...it's an pleasure for us having you here..... !!!
Trading has nothing to do with the luck..it is all about respecting the rules,reading the price and selection criteria...I suppose you sold it on the DBHLC at 1.10 level...but the PA candle closed within the small RM's range, so no space till a very clear TG, no MM space !
In these cases you have 2 options: 1- waiting and select a PA candle with some reasonable space till the RM's S or 2- wait and select the PA that actually close below the consolidation (d RM ).
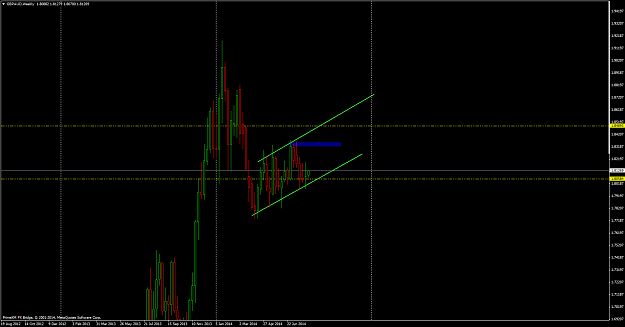
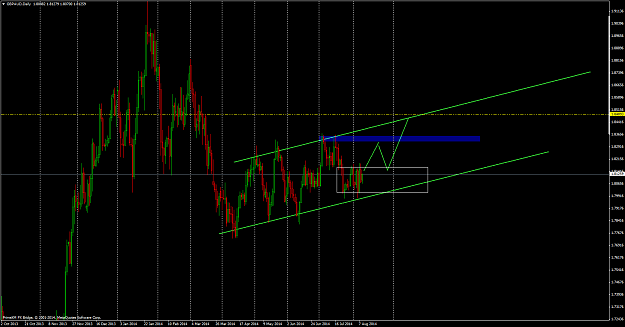
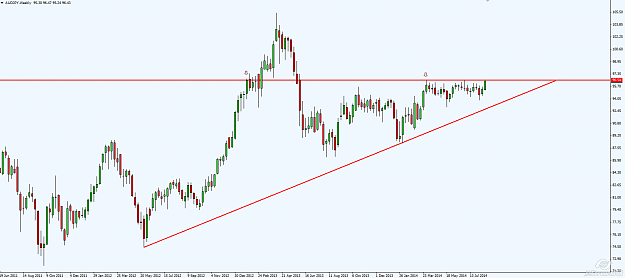
Possible scenario on gbp/aud
M - RM and stayng above M - S 1,8016
W - dinamic s/r upper channel and reaction at the bottom showing bullish momentum
D - RM at M/W support
|
Commercial Member
|
Joined Nov 2010
|1,178 Posts
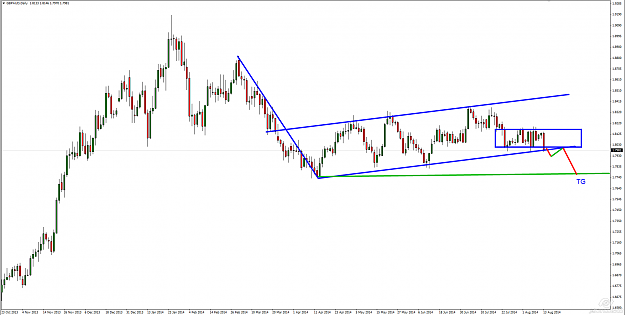
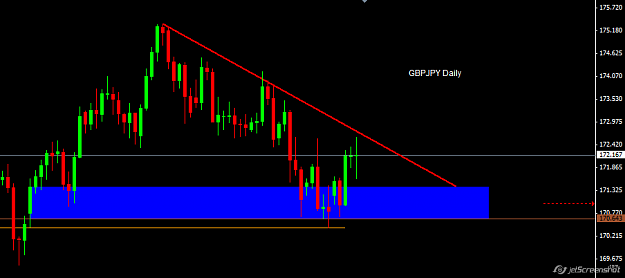
GBPAUD
The P is in bullish RET into a bearish overall trend = bearish flag = dynamic RM...if the BEOB will close below the D RM, then the flag's base will become the 1° MM / TG level !
GBPAUD The P is in bullish RET into a bearish overall trend = bearish flag = dynamic RM...if the BEOB will close below the D RM, then the flag's base will become the 1° MM / TG level ! {image}
Ignored
Thanks for your comments FXgroup, it helps a lot...
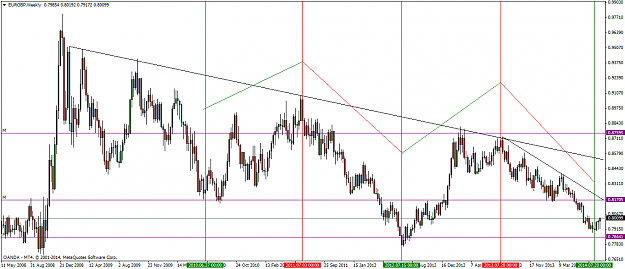
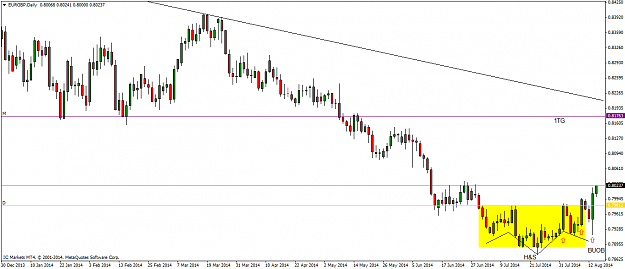
I would like to share my thoughts on EURGBP. M chart formed PB near M level, P didn't touch it but was pretty close.
On W I've shown something I find interesting. I've drawn vertical lines that separate bulish from bearish cycles for the past 4 years. This pair is like a clock. Every year around July trends change from bullish to bearish and vice versa. So it looks like we are in for a bullish cycle now. On D we got H&S with a nice BUOB as confirmation after breaking out of RM. Plus there are HH and HB and the bullish candles are getting taller and taller.
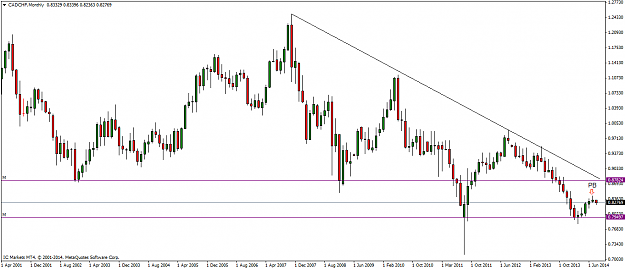
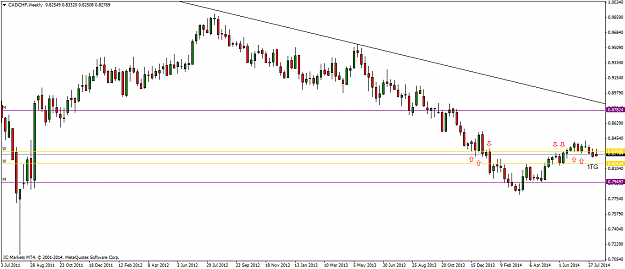
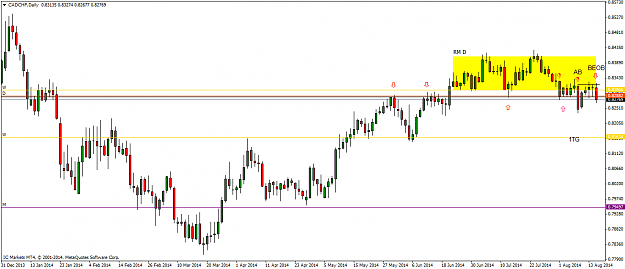
CADCHF
M bearish trend, bearish PB on RET
W P closed below a W level
D P closes below RM but not below D support.Then on 8.08.2014 the P formed a Bearish anchor bar(AB) that closed below both RM and D support. We had 4 days of RET that couldn't close above AB's high, followed by a BEOB. The ongoing geopolitical tensions also support the case of CHF appreciation.
{quote} Regarding GBPSGD....I fully agree with your analyse and you did a nice job seeing the January doji as CB ( controlling bar ) , except one thind....I see HH+HL on both higher TFs ( M+W )...so that's why I prefer waiting for the P's reaction at the doji's low as S of the RM..a second option you could wait for The P to close below the ML ( middle level of the RM ) and then for the ML to become R as information of the bearish continuation: {image}
Ignored
Did you follow the P ?...look where the P is now !
GBPSGD
Yes, too bad that it just fell through the middle line and never retraced to it or to the H&S's neckline before that for confirmation, so I sat on my hands (I didn't want to chase the market). Now I will wait for PA at S. I think that this pair is due for correction now and bullish PA at S would probably send it back up to test the ML.