Dear Emmanuel and Direwolf,
Taking a cue from you guys, I deliberately took a break (from last Friday) from real account trading ... Will be on break till this week closes ...
Went through all of Big E's posts along with posts from you guys, Snarylkack, Number3s (Hope I spelt their names properly) .... And ... http://www.forexfactory.com/showthre...11188&page=226
You guys are right ... It is Ocean of Knowledge ...
Went through few posts and charts ... multi times ... analyzing ... Comprehending ... Making notes ... Testing previous history etc etc ...
Now, I'm better armored ... better prepared ... to say the least .... For my own Wheel Barrow ....
Somehow .... Big E's one statement keeps coming to my mind ...
"Do not add anything ... Thinking trading can not be this easy .... Just Trade as it is laid out in TDI ..."
THANK YOU GUYS FOR ALL YOUR SUPPORT ... EDUCATION AND CHARTS ....
Aditya Kashyap ....
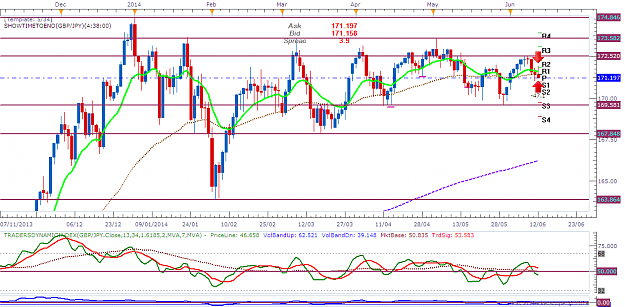
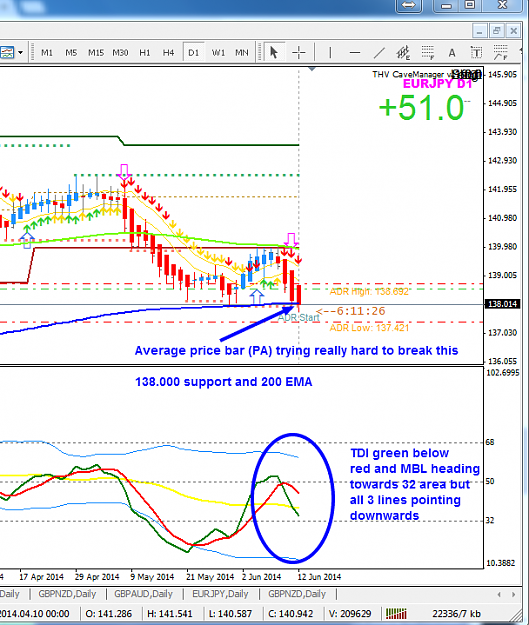
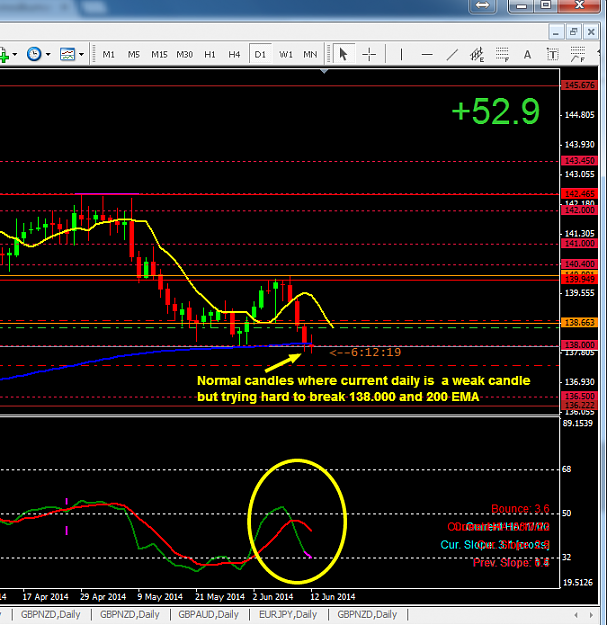
Following up on my current trade with EJ daily and post #38,240 .I have already taken my 114 pips profit yesterday and current trade is an added trade to yesterday and is still doing good. I got 6 more hours in the new candle from my broker.
It would be interesting to see if the current candle breaks the support area, shown in the images below or bounce back and consolidates as it is Friday tomorrow, I might close this trade manually.
Following up on my current trade with EJ daily and post #38,240 .I have already taken my 114 pips profit yesterday and current trade is an added trade to yesterday and is still doing good. I got 6 more hours in the new candle from my broker. It would be interesting to see if the current candle breaks the support area, shown in the images below or bounce back and consolidates as it is Friday tomorrow, I might close this trade manually. Please feel free to comment and suggest....
Ignored
Hi MrAussieFX, are the large pink arrows an indi you have on your chart, i was wondering if you could point me to it, thank you, Shane.
Joined May 2008 | Status: Grand Poopaw | 1,483 Posts
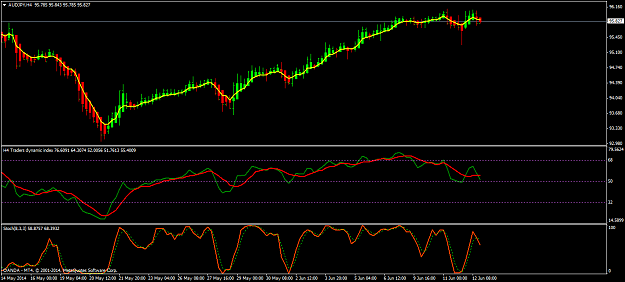
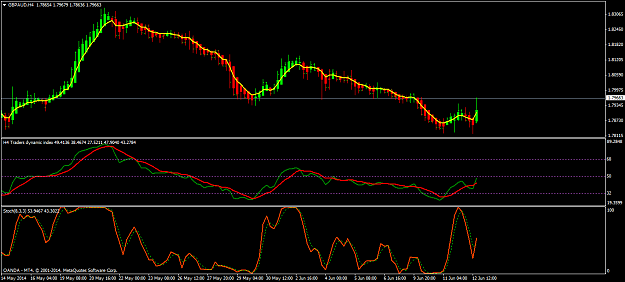
Top of the weekend to you all ! Go to any 1 hr/4hr chart, just look at the TDI... now scroll back about 6-12 months. It looks like rolling waves all along the TDI.
So why not get in at the top or bottom of the TDI.. You no that price always returns to it's previous levels.
If you entered when green crossed the red ... and stayed in until it crossed again ... I believe you would make more pips than you think is possible ...
Attached Image http://www.forexfactory.com/attachme...1&d=1313271570
Maybe I should not have a SL. Just close the trade when TDI crosses back in the opposite direction. Anyway here are the charts with candlesticks for easy viewing
... Just be aware how close you are to the 68 & 32 line and pay close attention The TDI and Stochs are giving opposite signals... Also pay attention to the left on the TDI for tops and bottoms... there pretty accurate for reversals... It may be ok but I would have passed looking for another chart set up... I only pick the best chart set ups to trade... there are plenty and no itchy finger here to jump in... just pick the most solid looking set ups... it 'll make you lots of pips. Just my 3 cents...
When checking out the TDI for a possible trade: Think of a wall clock here and it's arms... you want to see the green line for along trade at the 12-2 angle for best results and ashort trade at a 4-6 angle... This is basic 4x stuff... Don't try to read things into the TDI just so you can get into a trade... If the green line looks like it's at a 2-4 angle... it's weak. Pass on it. This holds true for PA too for best results...
Reaping EZ pips just keeping it simple. In my opinion(just cause of all the thread drama) Every one should just download the PDF Big E Comments and forget the thread. Anything else a lot of these people post in here is just going to confuse/distract from keeping it simple.
Remember guys the TDI is the HEART of the system.... so quit trying to give it a transplant!!(fibs, guppies, channels, MBL, extra MA's, etc)
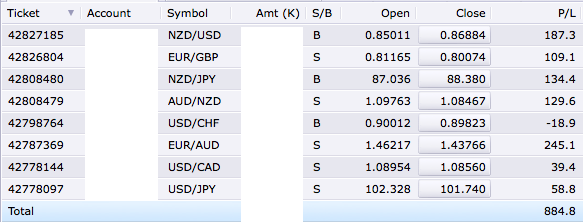
Open Trades
Attached Image
Closed Trades for Today
Attached Image (click to enlarge)
K.I.S.S!!!!!!!!!!!!!!!!!!!!!!!
Luck is what happens when preparation meets opportunity