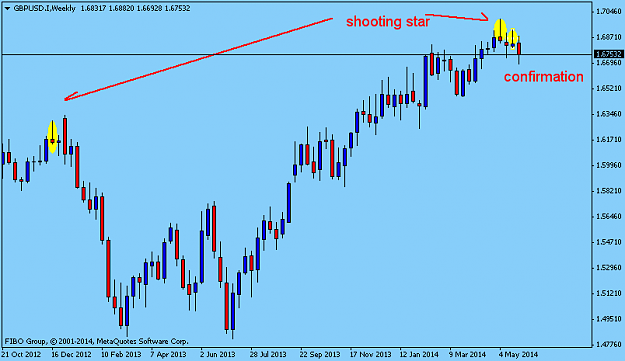
new changes for weekly GBPUSD shooting star will show us a free fall in the next days .even we have a close daily above 1.69 {image}
Ignored
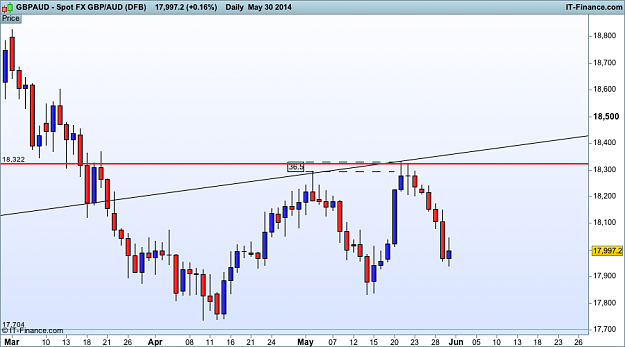
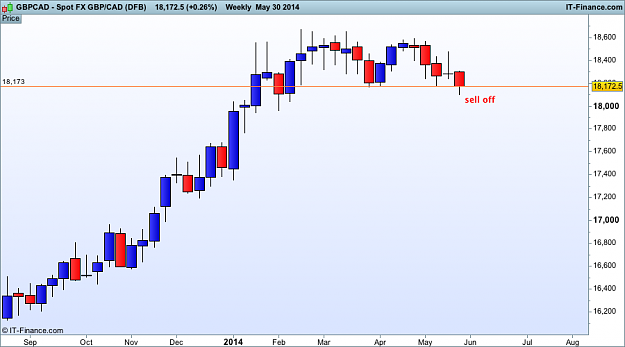
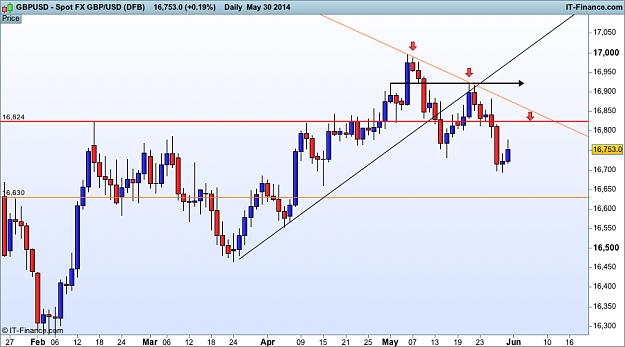
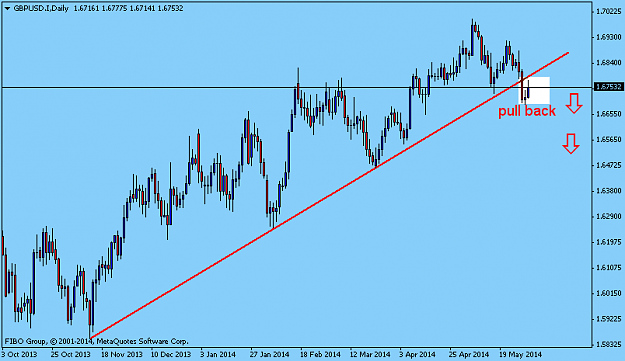
Hussin as you said 10 days ago , this days we see the beginning of cable fall. Targets pointed based on retracements 38.2%, 50%, 61,8% that converge with support areas. Now around 140 pips +
Attached Image (click to enlarge)
"Even A Thousand Mile Journey Begins with the First Step"
we know that an On Nick line pattern is a bearish continuation candlestick pattern . daily candle chart JPYLFX show us end of pullback . maybe bullish Hammer(weekly) is a false Hammer . {image}
Ignored
Confirmation of the end LFXJYP pullback ... so now its interesting the series of spinning tops and hunging man in a down trend resistance area on USDJPY, and as You said a weekend ago, maybe short time for this pair (better to wait for a confirmation bearish candle that break the blue support line)
Attached Image (click to enlarge)
"Even A Thousand Mile Journey Begins with the First Step"
{quote} Hussin as you said 10 days ago , this days we see the beginning of cable fall. Targets pointed based on retracements 38.2%, 50%, 61,8% that converge with support areas. Now around 140 pips + {image}
Ignored
hi analizer sorry for Delay.I rested and focused.Along the coast of the Caspian Sea. i will answer to your post in next posts
{quote}hi analizer sorry for Delay.I rested and focused.Along the coast of the Caspian Sea. i will answer to your post in next posts
Ignored
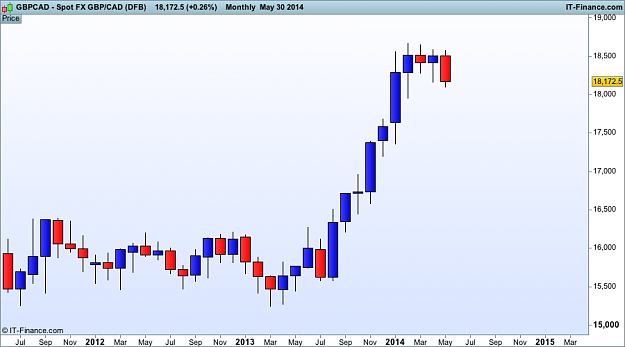
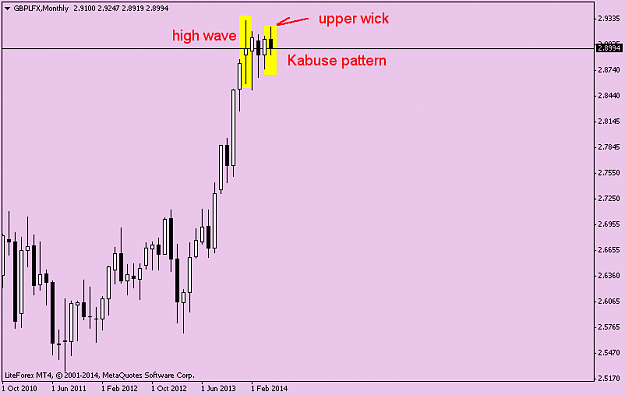
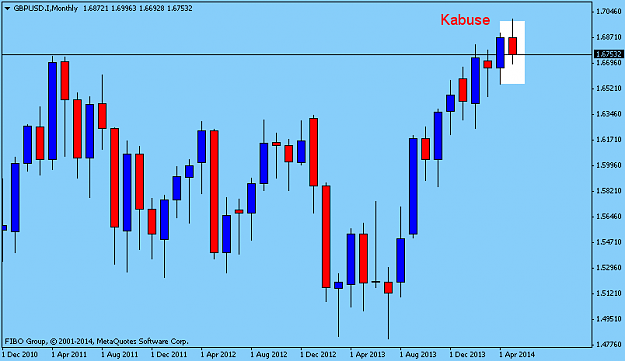
high wave candle has shown to us change trend in the past weeks.
Incertitude is a sign by this candle .we are speaking about a monthly candle.now after a high wave we can see a Kabuse pattern. in fact , a Kabuse is confirmation for a high wave candle .Market hands form bull camp to bear camp.
upper wick of Kabuse give me a Confidence
{quote}high wave candle has shown to us change trend in the past weeks. Incertitude is a sign by this candle .we are speaking about a monthly candle.now after a high wave we can see a Kabuse pattern. in fact , a Kabuse is confirmation for a high wave candle .Market hands form bull camp to bear camp. upper wick of Kabuse give me a Confidence {image}
Ignored
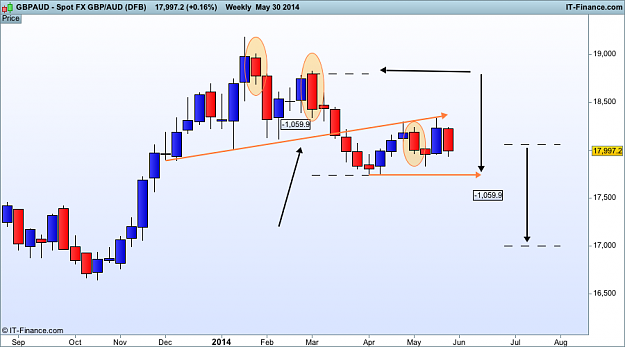
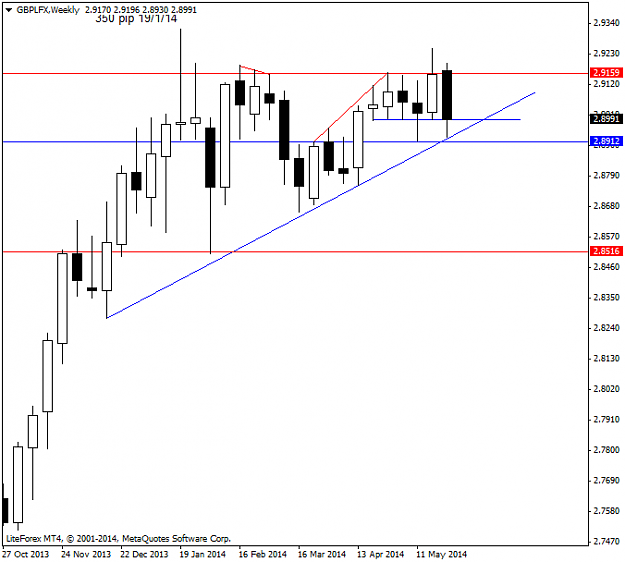
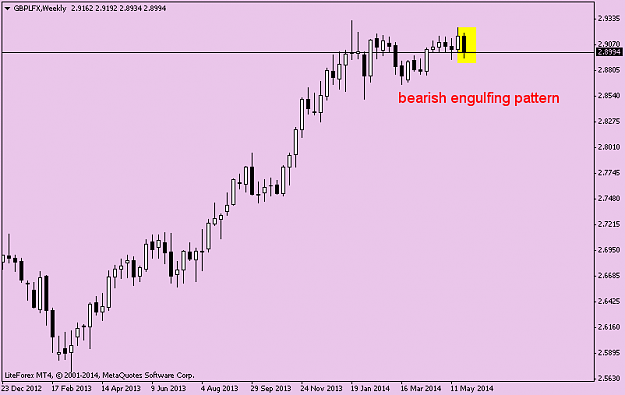
for weekly candle chart GBPLFX we can see a bearish reversal pattern with high reliability
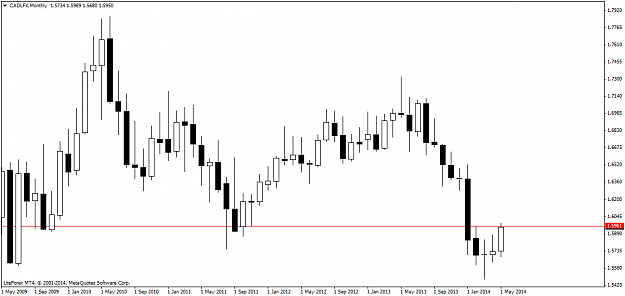
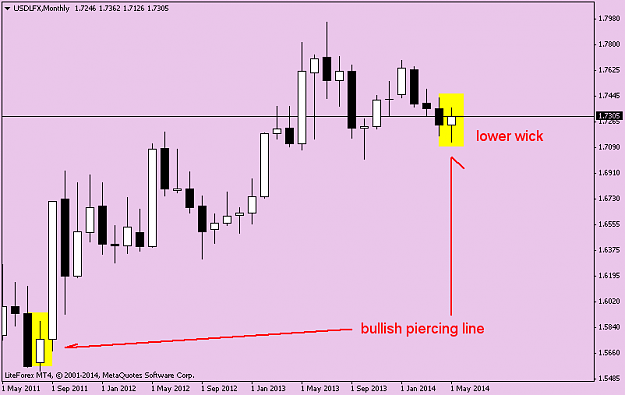
{quote}for monthly candle chart USDLFX , a bullish reversal pattern attention to lower wick(Aggregation of buyers) {image}
Ignored
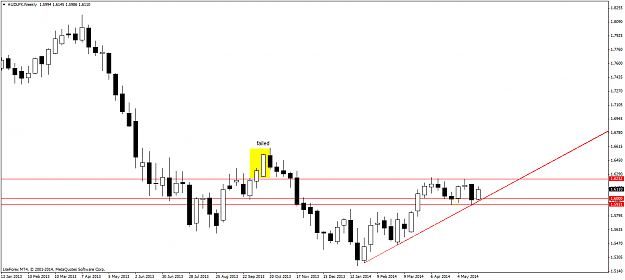
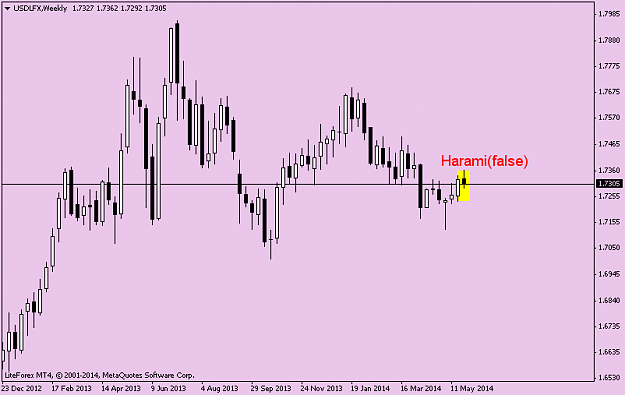
for weekly candle chart USDLFX we can se a bearish pattern of course a false bearish pattern . why false bearish pattern ? i will answer in the next post
{quote}for weekly candle chart USDLFX we can se a bearish pattern of course a false bearish pattern . why false bearish pattern ? i will answer in the next post {image}
Ignored
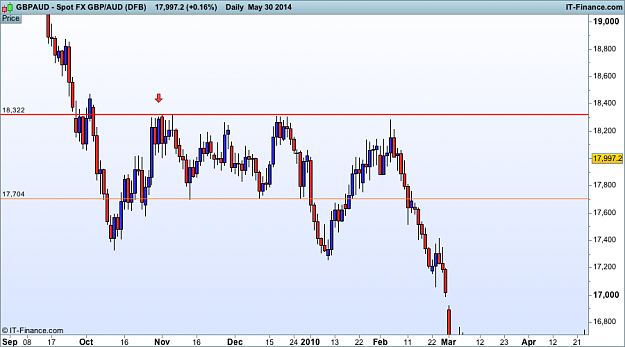
i have said that bull camp USDLFX need to a close above 1.73.
after a breakout (TL) and a close daily above 1.73 then we can see a pull back toward TL. but still we have a weekly close above 1.73.
also resistance line changes to a support line.
{quote} Hussin as you said 10 days ago , this days we see the beginning of cable fall. Targets pointed based on retracements 38.2%, 50%, 61,8% that converge with support areas. Now around 140 pips + {image}
Ignored
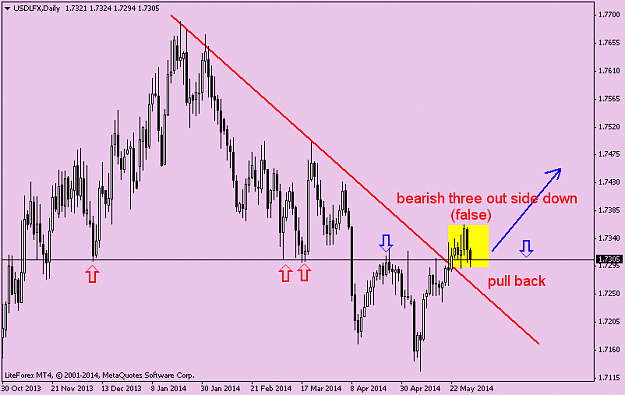
analizer , only we can see a false bullish pattern for daily candle chart GBPUSD (a pull back) and then down down ....
i see GBPUSD under 1.65 In the days ahead
{quote}analizer , only we can see a false bullish pattern for daily candle chart GBPUSD (a pull back) and then down down .... i see GBPUSD under 1.65 In the days ahead {image}
Ignored
Attached file GBPUSD D1
Yes, I agreed on your view. It's now pullback up, already broke TD trendline and more further down highly possible in my opinion too.