Joined Jan 2007
|
Status: Senior Member
|6,517 Posts
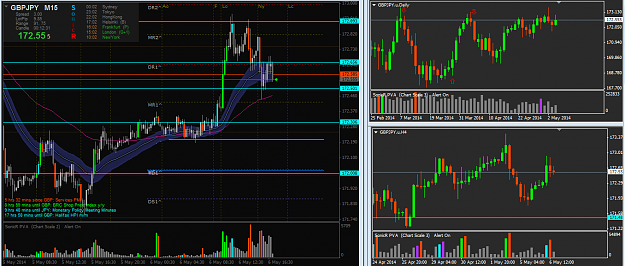
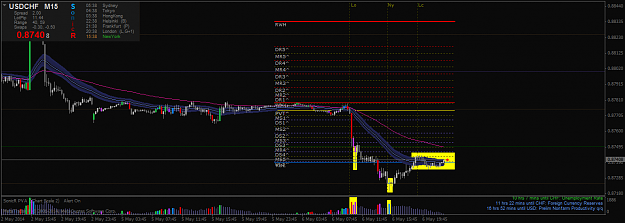
GBPJPY, another lesson in patience for me as a short term trader. Closed 1st short to soon with a -1.6 net pips loss. It's not the pips lost but the lesson in patience for me. Feinan made a good analysis and short call!
hansma, i donot know your analysis, but i think you are professional trader. i rarely see your post in topic.
Ignored
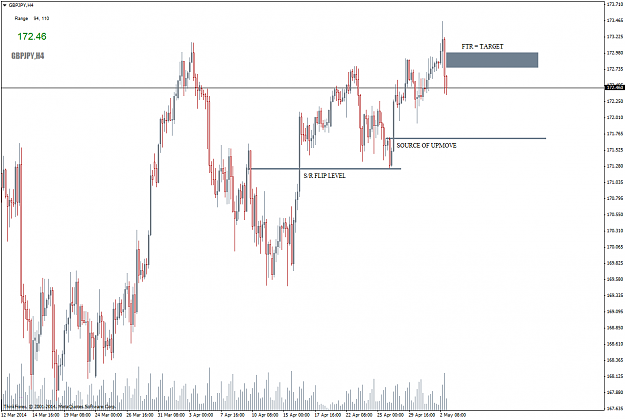
The analysis is simply where the decission is made on price for it to go up or down - these points in my chart shown as FTR and source of upmove
are very likely to be tested again.
I've seen that many traders here are using supply/demand zones on their charts. They can be used to determine profit target or stoploss for example. As Sam Seiden explains on FXStreet, demand zones are defined by a drop-base-rally or a rally-base-rally price pattern, and supply zones are defined by a rally-base-drop or drop-base-drop price pattern...
Ignored
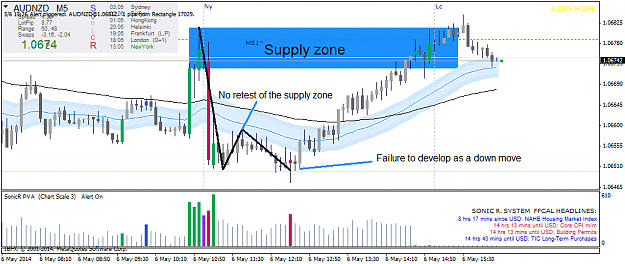
Here is an example of a bearish Classic Setup that did not result in a down move. We can se that the supply zone was not tested and although there was a pullback to the dragon and then a lower low, price did not continue downwards.
{quote} Here is an example of a bearish Classic Setup that did not result in a down move. We can se that the supply zone was not tested and although there was a pullback to the dragon and then a lower low, price did not continue downwards. {image}
{quote} must touch the dragon for valid classic setup?
Ignored
No, but I prefer the entry not to be too much further away from the dragon. And I prefer if the pullback is touching the dragon. But perhaps I'm wrong and you should read post #1 and all the attachements to learn it correctly.
EURUSD, IMO a good clue was provided (not a classic but); long wick with high volume on the red candle followed by next small red candle with smaller volume then stopping volume and finally higher volume on green up bar and up she went all taking place under the whole number 1.39000, and of course dragon above the ema headed up! {image}
{quote} Here is an example of a bearish Classic Setup that did not result in a down move. We can se that the supply zone was not tested and although there was a pullback to the dragon and then a lower low, price did not continue downwards. {image}
Ignored
Dvarrin - I would have read the chart the other way/ This is because there was a lot of volume at the bottom of the down move candles and I would have adjudged MM to be bull. I am still learning, maybe. And thanks for the examples
{quote} Dvarrin - I would have read the chart the other way/ This is because there was a lot of volume at the bottom of the down move candles and I would have adjudged MM to be bull. I am still learning, maybe. And thanks for the examples
Ignored
You're right There was too much volume on that green bar! PVRSA is really a beautiful tool to analyse the charts :-)
{quote} Hi Loeil, I had been puzzling over something for a while now and hope that you can clear some light. How do you differentiate a push down by short vs a accumulation by bulls. I am asking this question because I would think MMs are longs. And on the flipside if we are wrong, the PA can be read as bearish as a push down and then continuation ... How do I clear my head of the doubts and get a clear idea whether MMs are long or short. {image}
Ignored
Hi TaDaDa, did Loeil get back to you on your questions? I am interested in the answers too!
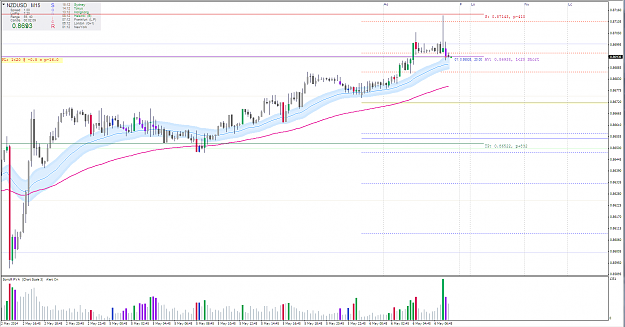
NZDUSD.-
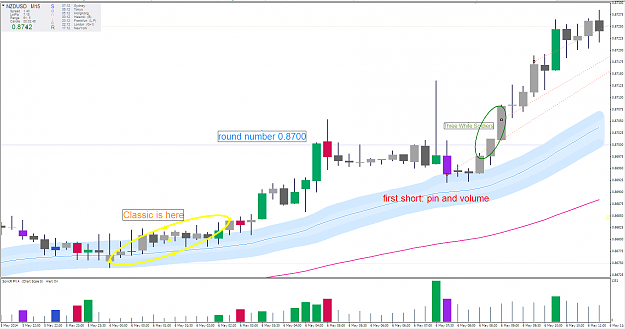
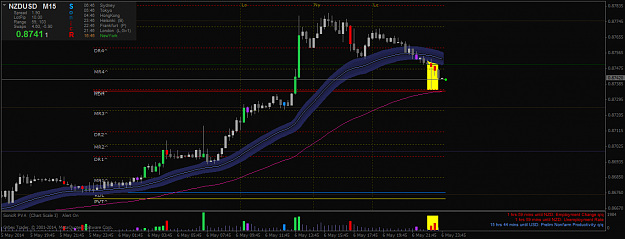
A good example of the lack of discipline in this business. I took short and placed a stoploss, but not respected. The consequences, -150 pips. Although I guess the price will fall, fear and fatigue make me close my trades with losses.
{quote} NZDUSD.- A good example of the lack of discipline in this business. I took short and placed a stoploss, but not respected. The consequences, -150 pips. Although I guess the price will fall, fear and fatigue make me close my trades with losses. {image} {image}
Ignored
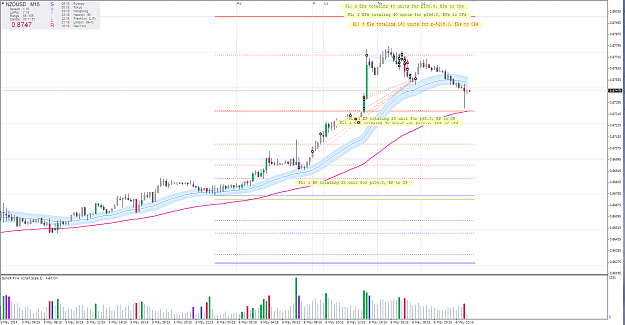
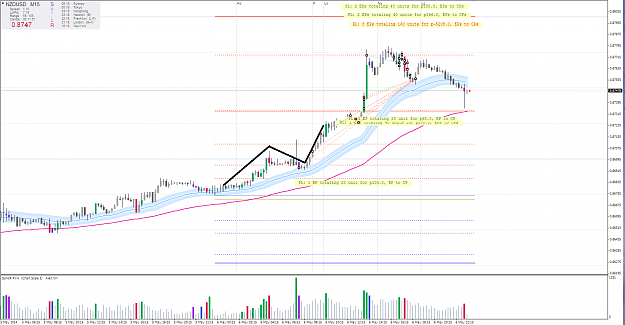
you entered a short on a classic long. then added more as you were in the red. it wasn't a matter of not being disciplined, it was a matter of not entering properly into this trade
{quote} you entered a short on a classic long. then added more as you were in the red. it wasn't a matter of not being disciplined, it was a matter of not entering properly into this trade {image}
Ignored
If you take a pin that is not confirmed, because it seems very powerful: we must respect the stoploss. The problem was not respecting the stoploss. The problem is lack of discipline.
The other entries are like as you say, allisonmagic.
{quote} NZDUSD.- A good example of the lack of discipline in this business. I took short and placed a stoploss, but not respected. The consequences, -150 pips. Although I guess the price will fall, fear and fatigue make me close my trades with losses. {image} {image}
Ignored
I am new but one thing I am coming to terms with is - do not trade against the dragon unless you are very sure that the trend will reverse or you have a big bank.
For me, there are still some bulls in the background, although not as strong as earlier today