DislikedOne Traders Opinion; IMO, the true value of trading PVSRA can be seen by dropping down to the 1m chart, zooming out and observing how MM's use the key levels depicted on your Sonic charts as support/resistance and manipulate price. (I am not suggesting to trade this t/f but to only observe PA) I feel the sometimes hidden/cloaked intentions of MM's can be revealed with a true understanding and observation how these levels are used coupled with the coincided volume not seen on the higher t/f's. Granted, trading higher t/f's during the LS can and will...Ignored
No one should receive news of such analysis with surprise. Here is from the post releasing our indicators......
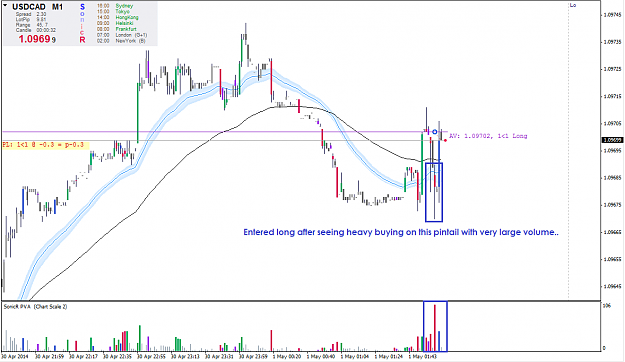
"The M1 chart is excellent for spotting if higher trading activity is occurring at highs or lows. The M1 chart does not reveal the status of MMs continuously due to times of conflicting signals. However, when the MMs activity will provide clues, they will stand out in real-time best on the M1 chart."
Anyone finding new the concept of viewing the M1 chart for PVSRA input to use in their overall analysis has not done their homework! Thanks to folks like Cigarguy, any slackers at least get a hint.
-tah