For people having problems to define profit targets, I find the following video quite interesting: .
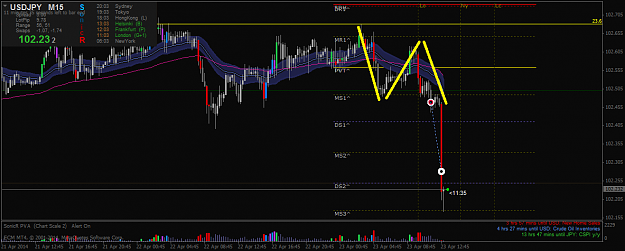
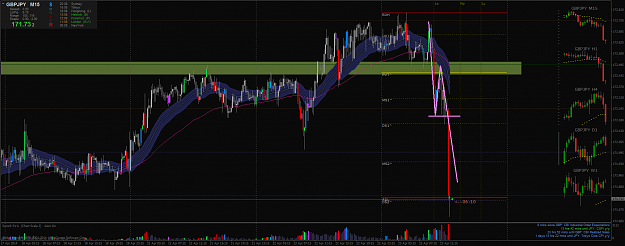
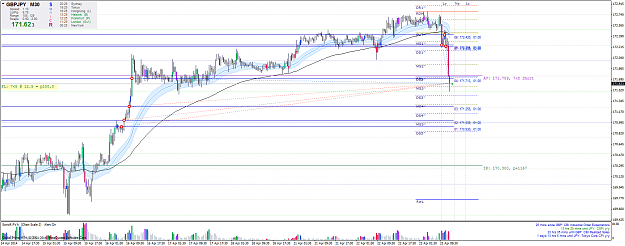
Basically, it shows that support in a previous up trend becomes resistance (thus profit target) in the current up trend and resistance in a previous down trend becomes support in the current down trend. This is different from what we usually learn, that support becomes resistance when broken and vice versa.
MMs will target those levels. For example, when the current trend is upward, MMs will target the next "old support" that is now resistance, and then there will usually be a pullback, before MMs push the price to the next resistance level. MMs can also push through more than one resistance level in one up move.
This will also help us to locate our entries: if there is a resistance level very close to the entry which has not bean reached already, price will likely not go very far upwards until it pullbacks.
The video explains how to draw the support and resistance levels.
Inserted Video
Basically, it shows that support in a previous up trend becomes resistance (thus profit target) in the current up trend and resistance in a previous down trend becomes support in the current down trend. This is different from what we usually learn, that support becomes resistance when broken and vice versa.
MMs will target those levels. For example, when the current trend is upward, MMs will target the next "old support" that is now resistance, and then there will usually be a pullback, before MMs push the price to the next resistance level. MMs can also push through more than one resistance level in one up move.
This will also help us to locate our entries: if there is a resistance level very close to the entry which has not bean reached already, price will likely not go very far upwards until it pullbacks.
The video explains how to draw the support and resistance levels.