{quote} Hi mor707, I think Zoopots only wants to show the cycles on W1, which do occur. As I understood - to make decisions about possible trades he looks at the daily to see if a countertrend move comes to an end - then he drills down on H4 to find a possible entry. fxfox
Ignored
fxfox,
Thanks for clearing that up for me. Now it makes more sense to me.
Thanks for your help. But please could you tell me how to make .ex4 file work? Is there something I need to do to the file before it can load as a template?
Week 3 day 3 of trading the 4 hour as shown on page 1: 6am: No Trades 10am: EU- +3 EG- -5 EA- +7 EC- +6 UC- -1 Total : +10 pips plus 80 pips, so +90 pips this week so far checking my computer 3 times a day {image}
Ignored
I didn't think there were any, but I knew you would squeeze some pips from the market!
{quote} Thanks for your help. But please could you tell me how to make .ex4 file work? Is there something I need to do to the file before it can load as a template?
Ignored
Do you have all the indicator in your indicator folder with exact name....
Just want to let you know that I will be a monk for about 3 weeks starting from 19th April and won't be trading nor surfing the internet during that time wish everyone a wheelbarrow full of pips!
Everything you can imagine, is real - Pablo Picasso
[quote=mor707;7378006]{quote} Hi Zoopots, I am studying your post about HTF analysis starting from the weekly chart as I think its a very important topic you are addressing here. I initially thought I understood what you meant but upon closer study I am getting confused. I hope you can clear my confusion, please. In you post you say you have placed a horizontal line on each 1st reversal candle after a up move......
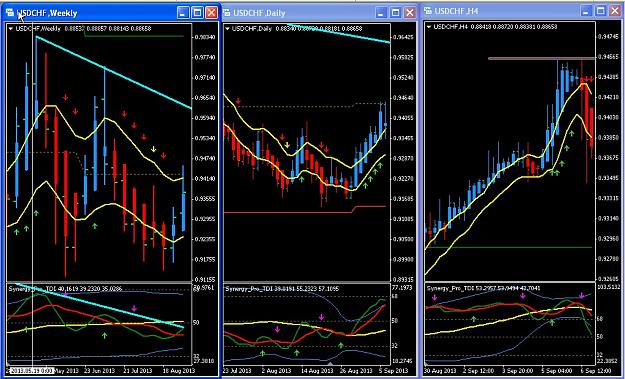
All three charts below are sitting at the same point in time. The Weekly is in a DT as evidenced by a lower high giving us the trend line as displayed and a TDI situation showing the MBL near neutral and the green line making lower highs as well. Chart analysis would say the bears have the momentum.
The Daily chart in the middle shows a Doji HA candle (normally indicating market indecision and possible change of direction) after 7 consecutive days of bull movement AND a hook setting up on the TDI. Analysis says the bulls had momentum for the past week but it looks like they're waning.
The H4 chart on the right...my go-to trade chart...confirms suspicions that the bears may be resuming the Weekly momentum and so one would trust the TDI cross on the open of the 9/6/1200 candle at .9438 and pull the trigger based on the favorable conditions of the H4 chart. The R/R is very agreeable as noted by the horizontal line I placed on the chart near .9457. All three charts in combination weigh into our decision to take the H4 sell signal.
If we just trade off of the Weekly, that chart, in real time, looks to be going long. But the Daily paints a picture of loss of Bull momentum and the H4 confirms that suspicion...so I would trust the H4 cross. Look at the H4 chart 12 candles previous and that TDI Sell signal cannot be trusted for the reason that you would have surmised continued Bull momentum.
{quote} Hi Zoopots, I am studying your post about HTF analysis starting from the weekly chart as I think its a very important topic you are addressing here. I initially thought I understood what you meant but upon closer study I am getting confused. I hope you can clear my confusion, please. In you post you say you have placed a horizontal line on each 1st reversal candle after a up move...... All three charts below are sitting at the same point in time. The Weekly is in a DT as evidenced by a lower high giving us the trend
Ignored
...
Ignored
I got to say this is MTF Analysis gold!
Really making it clear step by step what you're looking at in each time frame.
Hi guys. Just want to let you know that I will be a monk for about 3 weeks starting from 19th April and won't be trading nor surfing the internet during that time wish everyone a wheelbarrow full of pips!
Ignored
Best of luck man! Have a blast....It will be the same for me in a few weeks. I some unavoidable previous commitments I must honor.
{quote}All three charts below are sitting at the same point in time. The Weekly is in a DT as evidenced by a lower high giving us the trend line as displayed and a TDI situation showing the MBL near neutral and ....[/quote]
Hi Zoopots,
I think I am a bit of a slow boat and did not grasp your initial detail explanation, so thanks for all the additional information. I think I am now catching up.....your latest post filled the gaps I had.
Hi guys. Just want to let you know that I will be a monk for about 3 weeks starting from 19th April and won't be trading nor surfing the internet during that time wish everyone a wheelbarrow full of pips!
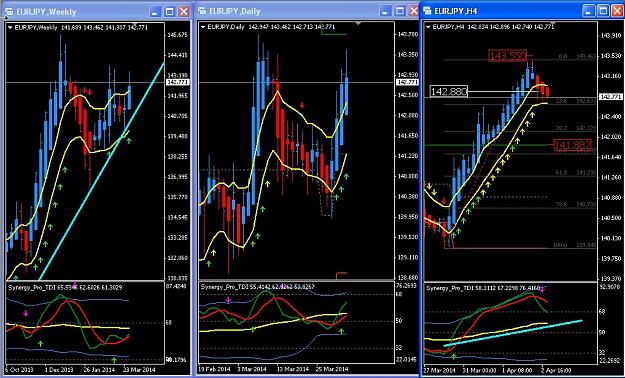
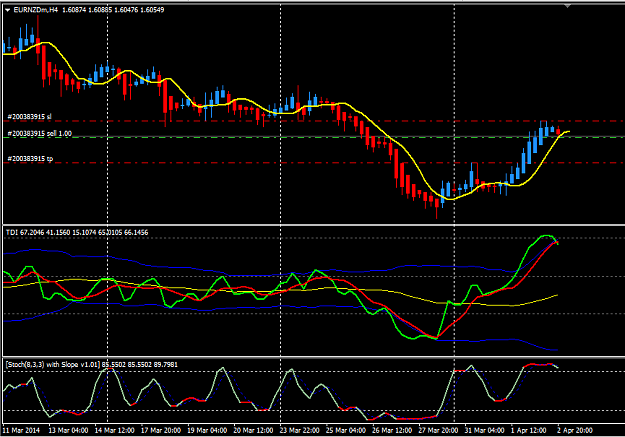
Since all JPY pairs gave a short TDI cross at the same time I took EJ on the short. So far so good. {image}
Ignored
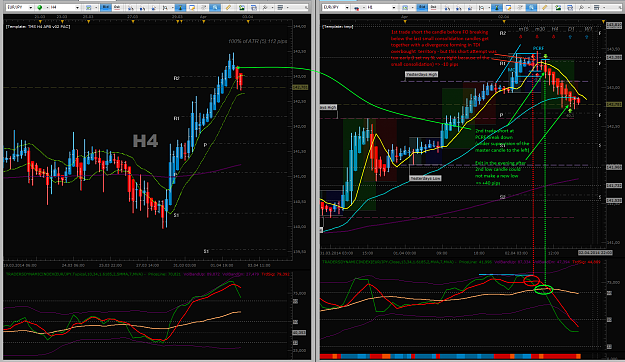
For what it's worth...a Sell is fighting serious Weekly, Daily and H4 MBL slope. While it looks like you may be positive on this position at the time of this posting, I would suggest you be ready to shut it down if the H4 TDI bounces or PA closes above the PAC. I placed your entry parameters where I guessed they would be on my H4 chart so I hope I'm close. ECB Bid rate tomorrow so if you're still minimally in profit...be careful as it could Kamikaze you. Good luck!
{quote} For what it's worth...a Sell is fighting serious Weekly, Daily and H4 MBL slope. While it looks like you may be positive on this position at the time of this posting, I would suggest you be ready to shut it down if the H4 TDI bounces or PA closes above the PAC. I placed your entry parameters where I guessed they would be on my H4 chart so I hope I'm close. ECB Bid rate tomorrow so if you're still minimally in profit...be careful as it could Kamikaze you. Good luck! {image}
Ignored
No worries mate. I have a trailing stop so its either gonna make me tons of pips or a few pips but either way its going to make me something. Thanks for the well wishes and same to you.
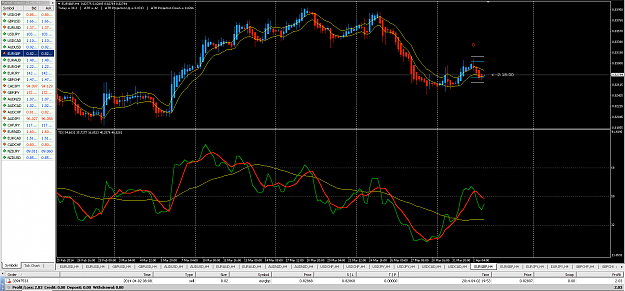
TDI's on H4 and H1 well in overbought zone, TDI in H1 was crossing down. => I expected a downside move neartime.
But my 1st trade was a little too early - made the fake out on FO candle to the upside and stopped me out. => -10 pips
(I am not really sure if it is worth to enter before FO - sometimes this time gave me good pips, but even often afterwards PA made a turn and FO / LO decide the real direction of the day)
2nd trade started the downside move, which I expected before. But only with small momentum as we can all see. Hardly earned pips in 7 hours trade.
=> +40 pips
Closed my EG trade. Price moved in my favor, then lost momentum and the TDI started to hook so i closed. +6 pips. I could have exited at a better price for over 10 pips but i was at work and i couldn't close my trade in time.
I'd like to share my technique of using higher time frame charts to facilitate my TDI H4 entries. I hope you will all find this informative and perhaps be able to cut down on some of your losses via "shoot in the dark" entries. One of my mainstay pairs is the USDCHF. I like to start my weekend analysis by analyzing the Weekly chart. Look at the Swissy Weekly below and notice the definite rhythm of pair. You have to understand that this is a weekly chart and as such, represents 300-600 pips of movement with each of the trend lines...I don't know...
Ignored
Hi...That is an interesting analysis you have...could you please tell me how you get your trendlines...is that custom indicator....Thanks for the information