Disliked{quote} Hey...just a quick question...does 'BUY when green above red amd above yellow, SELL when green below red, below yellow, use the PAC and look at the candles and their size' work for higher timeframes too? What would be the ideal TDI signals for the H4 - D? ThanksIgnored
You will find Zoopots reply below:
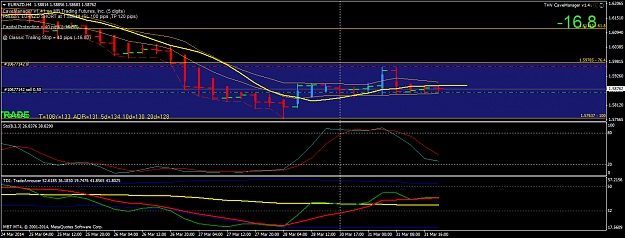
Disliked{quote} As previously mentioned in the thread: For a Buy: Green over Red over Yellow (with green pointing towards 2 o'clock and not "fighting" the slope of yellow) For a Sell: Green under Red under Yellow (with green pointing towards 5 o'clock and not "fighting" slope of yellow") {image}Ignored
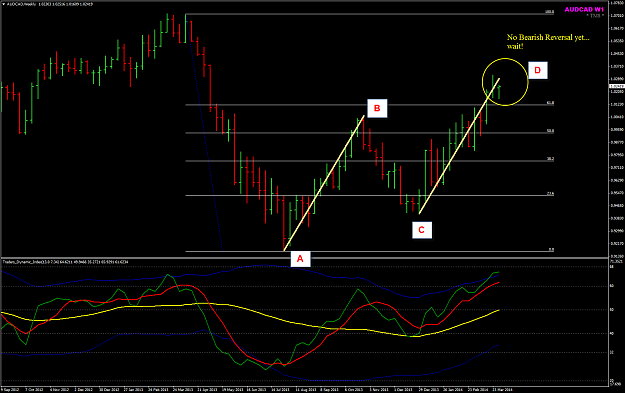
But when the TDI Green and Red move above the MBL Yellow, that is when most trade setups are CONTINUATION type of trades i.e. the trend has been established.
This same TDI characteristics is also true for D chart. Look at history charts and you can see how often these occur. Remember we must see both the Price Action and its Momentum using both the Price and the RSI(TDI).
Learn the RSI using the book- "RSI:The Complete Guide" by John Hayden.
regards,
EMMANUEL
Honesty is a very expensive gift. You wont find it in cheap people.WBuffett