Disliked{quote} I actually agree with a lot of what you are saying. It appears I am more focused on a near term analysis and you a bit further out. I like to be aware of the longer term trend so your post is helpful. When does the change of trend (box color) actually appear on your chart? Is it when a new monthly high or low is made?Ignored
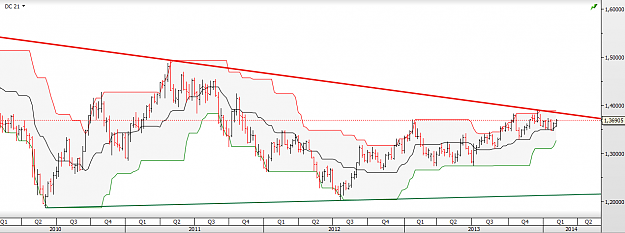
If current is above open, candle is blue.
If current is below open, candle is red.
It's just a away to try and spot support and resistance ranges based on candle opens and closes of the larger time frames as applied to the faster.
Typically, I use the H1 candle to trip the M1 and M5 charts, but as the market will play fractally as applied to all TFs, the view can be extended to include H4, Daily, Weekly and Monthly superimposed over the shorter time frames.
Money Can't Buy Happiness. Poverty Can't Buy SHIT! You Choose!