can an you explain to us, having a multi time frame indicator showing, especially a lower time frames than your trading time frame,
how to know to stay in the trade when the lower time frame changes colour and begins pulling back,
I know PHX 62 trades the 1hr with the 15m & h4 open at either side of his h1 chart, but I have found myself in and out of a trade like a yo yo.....
i understand that the lower time frames breath faster than the higher, but my question is to you and to PHX 62 .....
how far do you let the 15m chart pull back before you exit the h1 trade, ???
i am still having success at the end of the day but probably need to learn how to sit on my hands ???
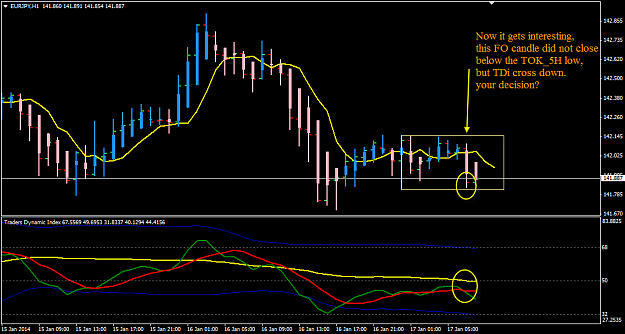
EJ 17 Jan potential for a TOK_5H breakout. Today would see a high probability breakout using the TOK_5H range. See that Master Candle? It would be rare to see EJ remain is such narrow range of 33pips. So let's all try grab some pips. {image} Remember the way Phx62 trades this pair. Now it is up to you to practise using those many trade examples he shared in this thread. Trade Well! EMMANUEL
Ignored
Would you wait for a close above or below, before entering, or just a break? Thanks.
{quote} Would you wait for a close above or below, before entering, or just a break? Thanks.
Ignored
I want to see the overall price action. Then I want to see a H1 breaks and close below the low or close above the high.
The TOK_5H range is 33 pips, so the initial SL can be 33pips or take the last swing high or swing low.
If there are previous APB/HA without wicks, I would place the initial SL using 2 bars look back.
Look at H4 condition and pick a bias.
Remember, those trades posted by Phx62, he made some very good observations about how EJ behaves after London open. Have those observations in mind.
Then have your Plan A and when that fails, activate Plan B.
Honesty is a very expensive gift. You wont find it in cheap people.WBuffett
Hi Emmanuel, can an you explain to us, having a multi time frame indicator showing, especially a lower time frames than your trading time frame, how to know to stay in the trade when the lower time frame changes colour and begins pulling back, I know PHX 62 trades the 1hr with the 15m & h4 open at either side of his h1 chart, but I have found myself in and out of a trade like a yo yo..... i understand that the lower time frames breath faster than the higher, but my question is to you and to PHX 62 ..... how far do you let the 15m chart pull back...
Ignored
Nelly,
There is no generic answer to this question. There is always the element of fear when we have open trades to manage.
It is all about market volatility and that shows in the candle size.
The best way to discuss this is to post and chart example and I'll try explain each different scenario on the charts.
The APB/HA is very good to use for managing trade exits. Pay attention to the APB/HA open and see the real price move using the APB/HA candle.
That will help people learn to use the APB/HA.
Honesty is a very expensive gift. You wont find it in cheap people.WBuffett
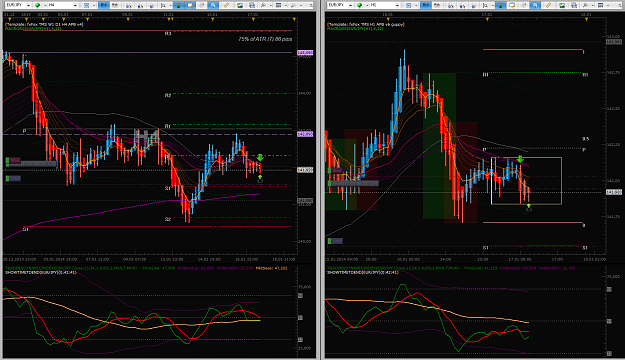
we are seeing a very bearish Frankie candle now... Edit: Add chart with LO now. {image} why did FO stop ? ... see my previous charts . The near term support 141.84...!
A new charting toy for multi-timeframe lovers. {image} who wants this?
Ignored
Nice tool - Even if MT4 is not my main platform, but MT4 is much more adaptable. This tool would give a good overview over a pair. If you're able to share it, it would be great.
{quote} Hi emmanuel7788, is it possible to look at it this way ? {image}
Ignored
Hi geomoon,
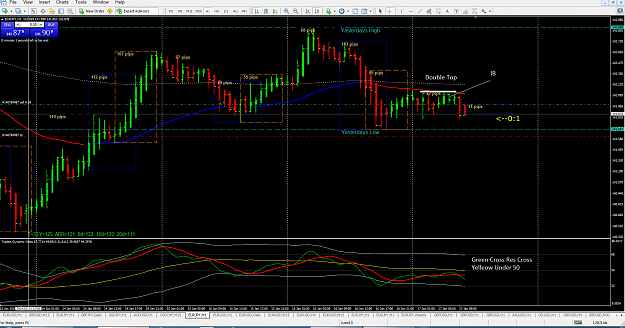
usually for a double top, we need to see price rally up then form high, then decline and rally to another high to the same level of the first high.
In this EJ chart, there was on significant rally upwards.
But I can see price is toppisch with the Asian High.
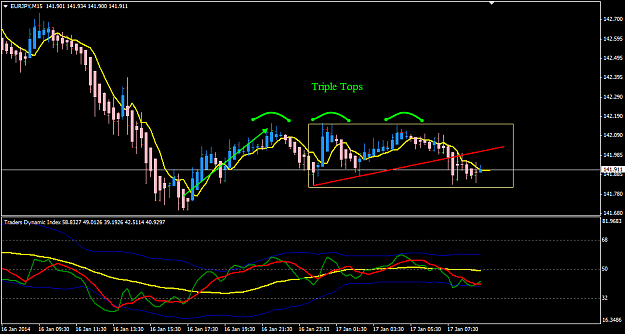
In fact when we zoom out on M15, we see triple tops.
Attached Image (click to enlarge)
Right now with Tokyo closed, we still do not see signs of strong sellers yet.
That 141.84 level still holding.
H4 TDi is going flat....
Honesty is a very expensive gift. You wont find it in cheap people.WBuffett
{quote} Hi geomoon, usually for a double top, we need to see price rally up then form high, then decline and rally to another high to the same level of the first high. In this EJ chart, there was on significant rally upwards. But I can see price is toppisch with the Asian High. In fact when we zoom out on M15, we see triple tops. Right now with Tokyo closed, we still do not see signs of strong sellers yet. That 141.84 level still holding. H4 TDi is going flat....
Ignored
exactly , I was actually looking at 15M and then zoomed out to see it like this.
Thanks
{quote}When I trade breakouts, I prefer to wait for the breakout candle to close to confirm the breakout. This is an important condition because we often see the candle pull back at the last few minutes or seconds. In that post#21,196, that was H4 example. That was a good example how price pulled back when that H4 candle closed. If I enter before that H4 candle closes, I need to see price momentum and breaking any near term (very recent) support and resistance. I also must mitigate the fact that I may not get a good price entry. I can then enter...
Ignored
Hi Emmanuel, really appreciate your input on this.
Can I check with you on the quoted above.
Q3. I was actually talking about entering upon the breakout of the range vs entering after the candle closes (confirming the breakout). My concern is that the latter might actually move 20++ pips until the close which may actually be a late entry, or the next candle may start to pull back.
What exactly do you mean by momentum when breaking out of the range?
Q4.
I saw the link for the bearish/bullish engulfing bars, was actually referring to your BUEB (http://www.forexfactory.com/attachme...5&d=1389795965) where the candle doesn't totally engulf the previous candle (lower wick). Shouldn't the engulfing candle (body+wick) totally engulf the previous candle (body+wick)?
Hoping to get my head straight on this. Thanks so much Emmamuel!
{quote} Hi emmanuel7788, is it possible to look at it this way ? {image}
Ignored
geomoon,
I am in this trade because for my "fxfox"-"phx62"-indication, the FO cangle gets red and the inside bar, but was some pips too late entering the trade (I was a little distracted...)
But because of there are no more sellers, and a lack of momentum to the downside, I decided to close 2/3 of the position by +5 pips and let give a chance, secured by a small stop loss above the "insidebar"-trade entry, so that if I will be stopped out it's is still a break even trade.