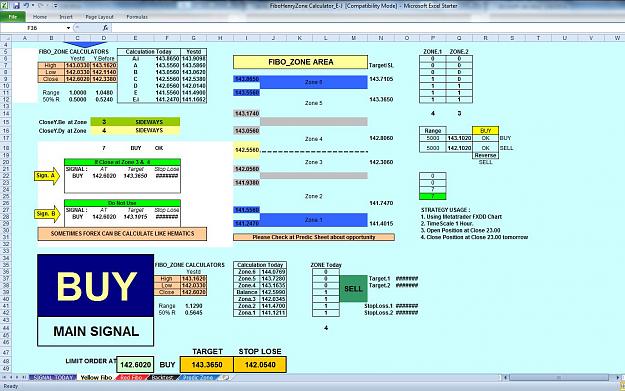
Disliked{quote} Let me explain it this way. This spreadsheet compromise my system. As I said last night I would not take a short off the secondary resistance or even the DPP because the cycle on my 1 hour was still in the up position but ended this cycle on the 09:00 ET candle this morning and is when I took the short. And according to the spreadsheet the stop loss was precisely at the resistance of 143.06 which the up stopped at 143.03 and reversed. Even though the spreadsheet gives a sell indication of the limited order at 142.33 I had found it is best...Ignored
Le's see if i have understood: that is to say that spreadsheet has given you the confirmation that both upside and downside were tradable providing daily resistance and support that are also targets for respectively the long and the short. Then of course you make your trading decision based on your own system taking count of cycles alignment.
The cycles you are looking for should be the daily, 4h and maybe the 30min on which you take uour entry and exit, is it correct?