{quote} Excellent. Are there any conditions in the long move tha would had made you close the longs an immediately jump in short? Sorry for so many questions hehe, but I feel like a kid in a candy store
Ignored
Besides my 1 hour chart the resistance on the Daily helped my decision.
Joined Jun 2007
|
Status: Trading Live For The Last 14 Years.
|5,761 Posts
With this scenario we just finish is an example what can happen trading against the trend. In consolidation you can trade both ways and this is one reason you cannot be bias. But also is a lesson on being totally and completely focus.
{quote} Besides my 1 hour chart the resistance on the Daily helped my decision.
Ignored
The resistance in the daily is one piece of the puzzle I don't see. I have the fibo 76.4 but it can comprehend a wider espectrum, at less of course you also have unison cycles in the daily chart
Best time to plant a tree was 20 years ago, second best is now
{quote} The resistance in the daily is one piece of the puzzle I don't see. I have the fibo 76.4 but it can comprehend a wider espectrum, at less of course you also have unison cycles in the daily chart
{quote} What I have found in using this spreadsheet is reading the Yellow Fibo and disregarding the Red. And the reason is because of the conflict with the Red Fibo - and being based with the G/U - gives a minor false reading between buy and sell in some areas of the Red Fibo. Even though the similarities are pretty much the same as for support and resistance the Yellow Fibo gives a more realistic approach for the Fibo. Take note of the 50% on the chart at 142.3080. This is the starting point of taking a trade. At closing of yesterday's candle -...
Ignored
Thank you Dove, your way to read spreadsheet is very interesting and keeps everything simplier than it looked.
Let me know if I'm correct: if daily opening is above static daily pivot and also above the dynamic one, then the first thing you look for is a setup long, even though spreadsheet is giving you two different signals ....i.e. a yellow buy and a green sell.
This will be valid unless cycles will stay above the dynamic daily pivot.
As we have also a green sell, that i guess is given by a possible retracement calculated with fibo's, if cycles will align below the DPP a short entry will be allowed too. Is that somehow correct?
{quote} Thank you Dove, your way to read spreadsheet is very interesting and keeps everything simplier than it looked. Let me know if I'm correct: if daily opening is above static daily pivot and also above the dynamic one, then the first thing you look for is a setup long, even though spreadsheet is giving you two different signals ....i.e. a yellow buy and a green sell. This will be valid unless cycles will stay above the dynamic daily pivot. As we have also a green sell, that i guess is given by a possible retracement calculated with fibo's,...
Ignored
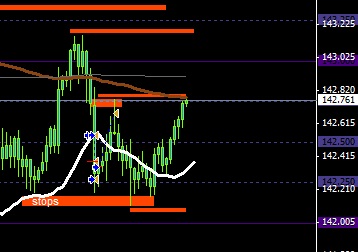
Let me explain it this way. This spreadsheet compromise my system. As I said last night I would not take a short off the secondary resistance or even the DPP because the cycle on my 1 hour was still in the up position but ended this cycle on the 09:00 ET candle this morning and is when I took the short. And according to the spreadsheet the stop loss was precisely at the resistance of 143.06 which the up stopped at 143.03 and reversed. Even though the spreadsheet gives a sell indication of the limited order at 142.33 I had found it is best to wait on the 50% before making a decision unless the cycle says other wise. In this case - the cycle said up and with the cycle up is the way I traded until it had ended the cycle and then it shot right back down into the trend. And by the way - this 143.06 resistance came off the Daily Chart cycle.