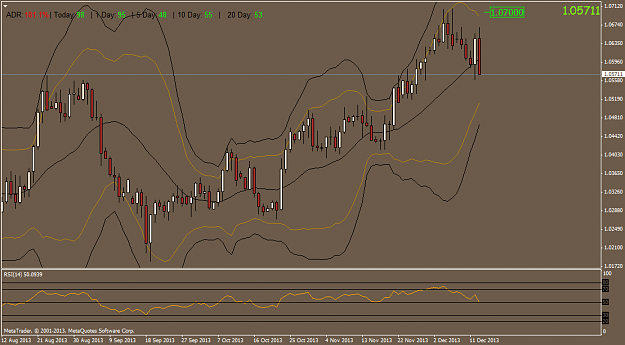
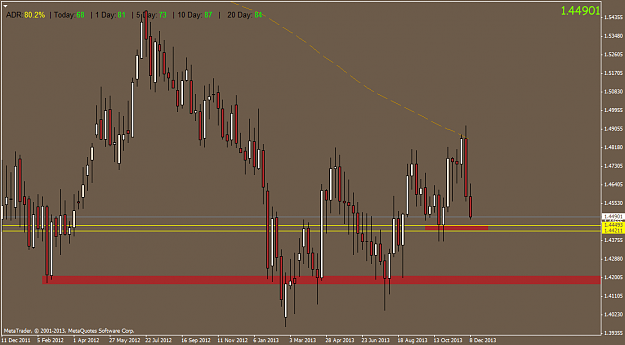
DislikedDaily Chart RSI touched the 70 level a few days ago. But it started to fall under 70 again. What does it mean? {image}Ignored
RSI 70/30 works best when market is in a range and on strong trends such as on Yen pairs price can remain 70+for hundreds of pips.
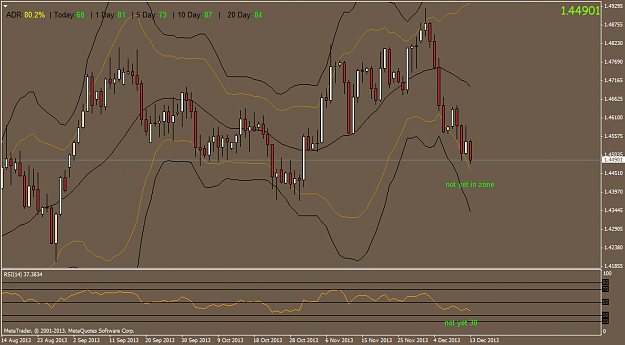
Trick is to combine RSI with another Tool.I prefer Bollinger Bands.Its my favorite indicator
Set 2 BB bands
1 deviation 2
2 deviation 3
When RSI is in 70/30 on daily look to see if price is inside 2-3 BB deviations then you might have a trade.
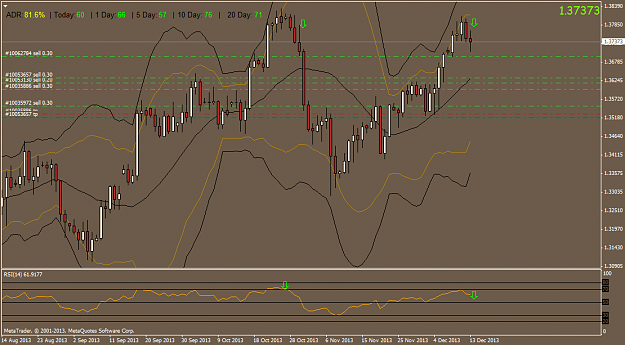
Attached Image (click to enlarge)
In trading, you have to be defensive and aggressive at the same time