{quote} jalkok: Thanks for the charts. Is that the TMS 10EMA Dashboard you are using? Mine only show up and down arrows.
Ignored
If you ment the arrows on the right upper corner of my charts, those are the trend display from the thread of "Lawgirl21" "Trading almost naked..."
Here you are:
{quote} Hey there... Just a little helping tip.. When looking at the tdi and price you must use the close price of the bars and not the lows.. the rsi of the tdi is calculated from the closing price and not the high/low.. Just something to look out for if your using it for possible divergence or confirmation or HH or HL.. Black lines on your chart show correct placement.{image} josh
{quote} If you ment the arrows on the right upper corner of my charts, those are the trend display from the thread of "Lawgirl21" "Trading almost naked..." Here you are: {file}
Got stopped out of my nzd/jpy trade also on the news. Was up 40 pips when it hit me and closed at BE. I was on the road at the time. Will check for imminent news events when away from computer and adjust accordingly. Would have been a nice trade otherwise.
{quote} Hey there... Just a little helping tip.. When looking at the tdi and price you must use the close price of the bars and not the lows.. the rsi of the tdi is calculated from the closing price and not the high/low.. Just something to look out for if your using it for possible divergence or confirmation or HH or HL.. Black lines on your chart show correct placement.{image} josh
Ignored
I've read that before but it must be a bit time consuming to do if you only use synergy bars as you can't see the close of the candle normally, also we are not really looking at the rsi we are looking at moving averages of the rsi. Ive tried looking for more information from Dean Malone on divergence with the TDI and can't find any, have you got any links?
{quote} I've read that before but it must be a bit time consuming to do if you only use synergy bars as you can't see the close of the candle normally, also we are not really looking at the rsi we are looking at moving averages of the rsi. Ive tried looking for more information from Dean Malone on divergence with the TDI and can't find any, have you got any links?
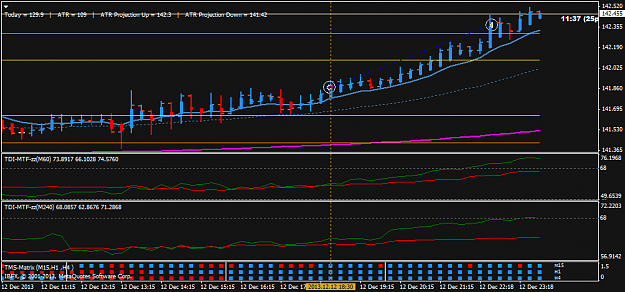
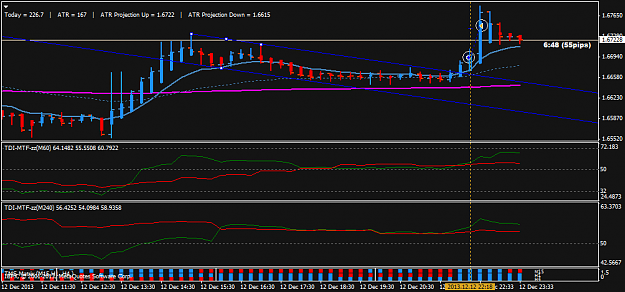
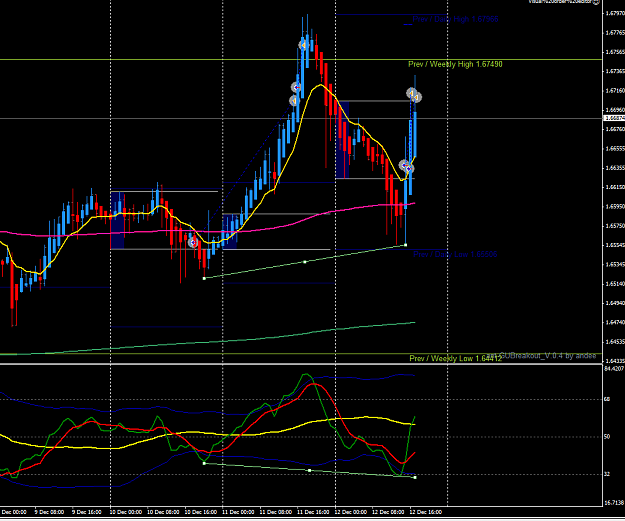
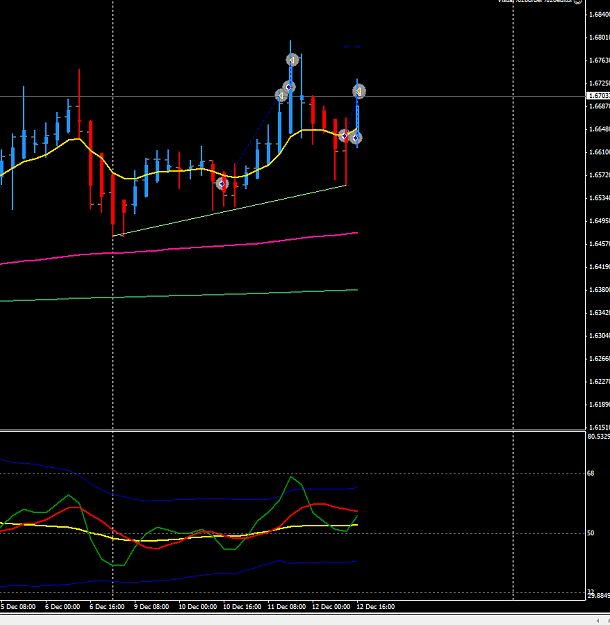
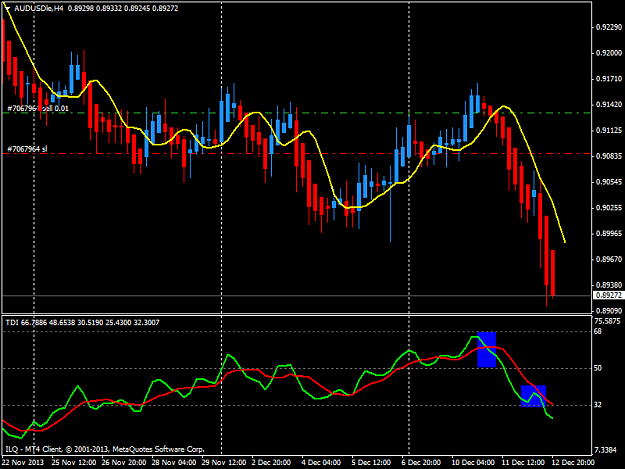
Yesterday's and today's trades on e/nzd, first one was entered on lower timeframe after H1 had the two long
pullback bars, clearly was an early entry on H1, made 150 pips, second was a continuation of the trend entered on m15 as well, made +45.
Today showed a really nice hidden bullish divergence ,with price bouncing off 200ema and a sharp cross on TDI,
entered with two positions, closed one for 80 pips and was planning to hold the second for longer target, but ended up closing
it for the same amount of pips.
I am also attaching H4 view.
Wishing Happy Holidays to All of You!!!!!!!
Attached Image(s) (click to enlarge)
If you're going through hell, keep going. Winston Churchill
|
Joined Dec 2013
|
Status: Shake and Bake!!!
|9 Posts
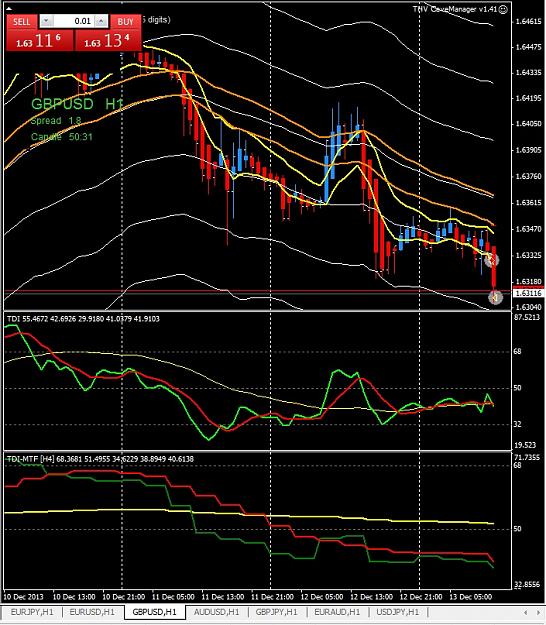
Hi all! Brand new memebr to FF, but have been forex trading and using the site for about a year. I came across this thread this week and feel like this method really suits my personality. I've currently got this position open that I took under the rules during the London session...
My setup is that I look for a pair that is clearly trending on the daily time frame with no real significant roadblocks ahead of it. When price pulls back to my daily MAs, I look for an entry to continue the trend...once again, strictly using the TMS rules. I'm looking for longer term swings, so i like to let the trade breathe. I'll move my SL to BE as soon as I can but this is something that I've got to learn to do better on the 4H charts, I've gotten myself stopped out of a couple of trades today and yesterday becasue I was too quick to take risk off. In this particular trade, you can see that I've moved my SL down to preserve profits as a result of the TDI "checkmark" formation. A full reversal would have landed a nice profit on the trade, but my patience paid off...I got the bounce off of the red line and price continues to fall...currently up over 200 pips...
Anyway, my thanks to all of those who have made this thread what it is and good luck to everyone!
P.S. I'm learning right now so I trade microlots at this time. Once my experience, confidence, and account balance dictate...I will be moving on up to the "wheelbarrel" amounts!
I have been reading this thread since last year and specially big fan of PHX62, Bizzzle and of course Big E. I have been trading with mix results. Although I do understand the system but I usually exit the winning trades quickly than losers. Which I need to do a lots of practice along with money management. I have question for IMi, the first trade went against you and you didn't exit. As of TMS rules you almost have sell entry. Can you please explain? Sorry Just trying to learn.
{quote} I've read that before but it must be a bit time consuming to do if you only use synergy bars as you can't see the close of the candle normally, also we are not really looking at the rsi we are looking at moving averages of the rsi. Ive tried looking for more information from Dean Malone on divergence with the TDI and can't find any, have you got any links?
Ignored
Hey there,
Yes it would be difficult to switch between the two different candle types but to spot the divergences correctly you would have to switch between the two as the rsi from the tdi would be calculated from standard candles of course...
Well you are looking at the rsi crossing over the moving average as the tdi is simply a rsi with a moving average applied to that rsi as far as i understand..
Josh
I was going to trade the Asian session but managed to get quite a few pips before that so will go to bed instead
There was a nice bullish breakout of a channel on m15 on EN, didn't even have time to move to breakeven and it had hit my 50 pip take profit, I actually got just over 54 pips as there was positive slippage of just over 4 pips. I took EJ earlier in the evening and got 50 pips - took a bit longer for that to reach it, also took GJ at the same time as EJ which also had a similar channel breakout to EN another 50 pips.
I have added Xaphod's tms-matrix for the alerts it gives, very helpful when looking at lots of currencies.
Please find below link where you can find the trade manager that can help you to manage your trade. This trade manager is modified version of the one that has been suggested by emmanuel in this post http://www.forexfactory.com/showthre...28#post6513628 .
I am using this trade manager with JSL and Close on Synergy candle color change(H4). This ea is modified by fxdaytrader on below post. Thanks to him for modifying the same. This trade manager has limitation to handle one pair at a time (it can manage only one pair on the chart pair it has been put with synergy candle color change). If in parameter usesynergy is set to false then ea can manage trade as mentioned on above link. http://www.forexfactory.com/showthre...15#post7152415
|
Joined Dec 2011
|
Status: The Little Guy
|145 Posts
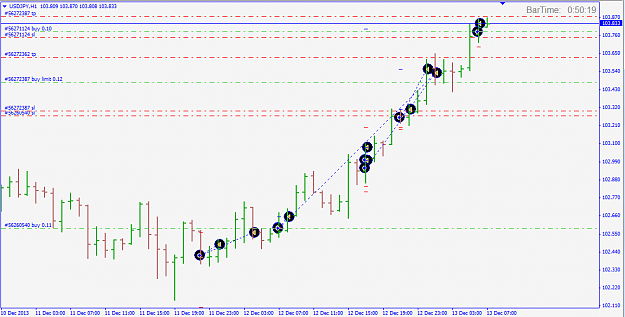
Hi guys. This USDJPY was a gift, and id like to show my trades for the past 24 hours. Trades were taken in different time frames, so its not possible to explain everyone, half of them were taken on M1 tf. And for the purpose of clarity i use clean template to show the trades. Gues i nailed it I am still waiting for 103.9-104 and if that holds, i intend to keep my remaining positions until 108 or so.