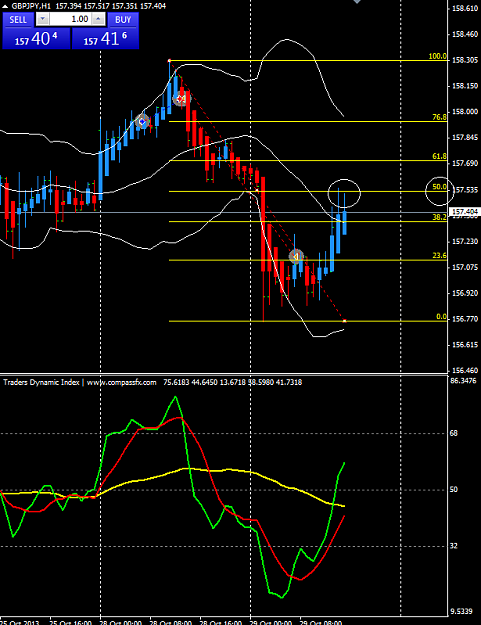
{quote} Trades closed EJ for 37 pips price fail to break below 134.28 with divergences! GJ closed for 96 pips, sold at the reject of 50% and manage to get back to 0! Was looking for a TP 155.80 but same as the EJ couldn't break lower.... I am also still short EU, GU, AU and AJ on 4 hour! Best of luck {image}
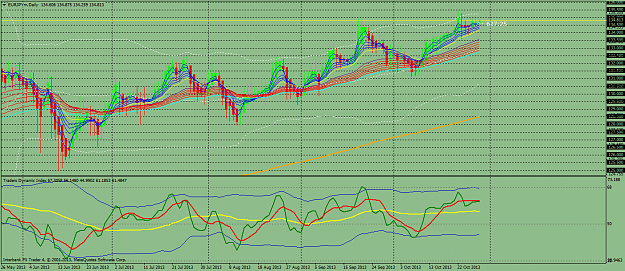
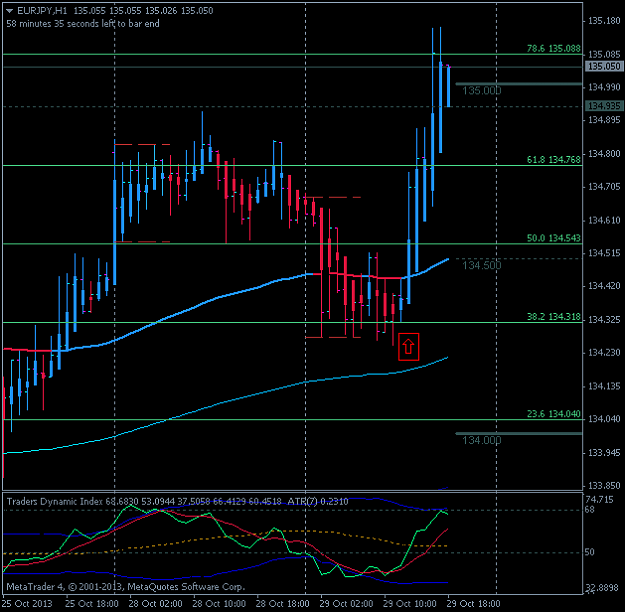
Here is my (long) trade from last night, the eur/jpy.
Keep in mind that I set my trades on the L/O
on the 4 hour chart and go to bed, then liquidate
out when I get up on the N/Y open/ Like Eelfranz did.
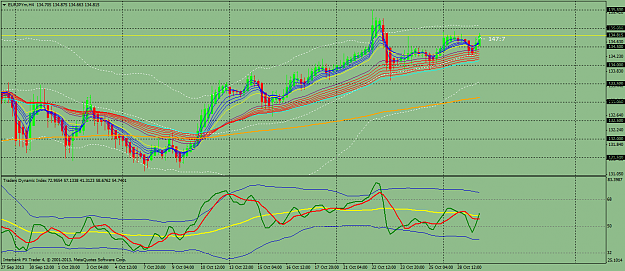
{quote} Closed for 40 pips at the DR1 {quote} Pretty neat, I dropped correlations a while back, decided I like simple better than stuff that require lots of work and thought.... {image}
Ignored
Good choice to close this trade on with +40 pips, looking at the wave and movement of the price, this could be a reversal zone
Attached Image (click to enlarge)
I Have Learned to Take Some Losses to Make Profits
Long E/U, G/U and short U/C orders triggered while I was in the shower. Forgot to put a buy stop on the correlated EUR/CAD (I would've went long as well) cause I was messing with the order of pair charts.
First pair 30 pips, and other two 15-ish in favour, S/L for Euro at BE, others 50 just for emergency.
Edit - Saw that E/J and C/J bounced. As a rookie I forgot this possibility and didn't put buy stops... Glad it's only demo, so this good lesson is free
Joined Jan 2012
|
Status: On my way to consistency...
|313 Posts
Hi guys and gals
I dont want to confuse you but i would like to share a chart to show you how TDI and technical analysis and some patterns can be used to predict market direction.
The key is to find areas on the chart where price is likely to turn and then move to a lower timeframe chart and enter once your entry requirements and rules are met.
If you rely on technical analysis and price action and use the TDI as a guide and confirmation tool, then its easier to be successful.
Look at the number of setups you can find on the chart ....
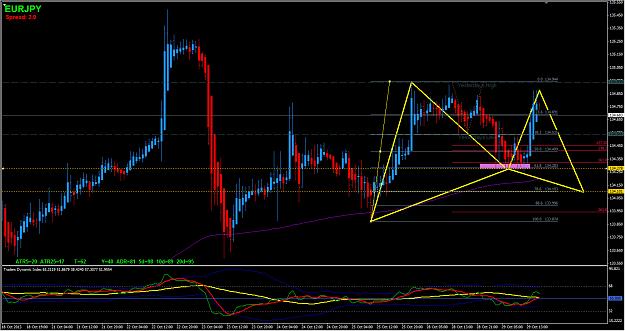
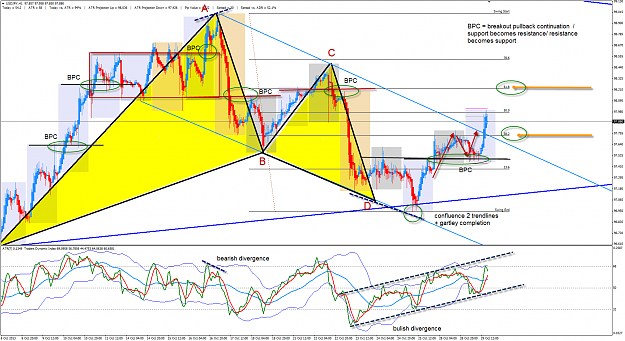
Hi guys and gals I dont want to confuse you but i would like to share a chart to show you how TDI and technical analysis and some patterns can be used to predict market direction. The key is to find areas on the chart where price is likely to turn and then move to a lower timeframe chart and enter once your entry requirements and rules are met. If you rely on technical analysis and price action and use the TDI as a guide and confirmation tool, then its easier to be successful. Look at the number of setups you can find on the chart .... {image}
Ignored
Great work mate,
I always learn lots from you, thank you so much!
Give yourself a chance and trade it like it's layed out...
Aminhakim, I tried to up load my template but ff system won't let me (to large). But you can input manual. 1). The tdi r/t and round numbers are located in the paper clip, on top of page. Just down load into your computer, put in experts file then indicator file. And close. 2). Bollinger Bands 50/2. 3). Ema 3,5,8,10,12,15 Blue, close. Short term traders. 4). Ema 30,35,40,45,50,55,60 Red, close. Long term investors. That's all you need. Nice meeting you! sj
Ignored
Snarlyjack
I think that you can zip the template first and than send it and then us lazy won't have figuer out how to make the chart.
Barry
Joined Jan 2012
|
Status: On my way to consistency...
|313 Posts
This is a GJ trade i entered today.
Try to understand the process behind the trade....
As you can see, i didnt took the trade because of TDI. I took the trade because of the setup. Then i went to 15TF, saw a red candle, with TDI cross, with bearish divergence and pulled the trigger.
now its time to wait for the 1H timeframe to confirm that price will continue in my direction.
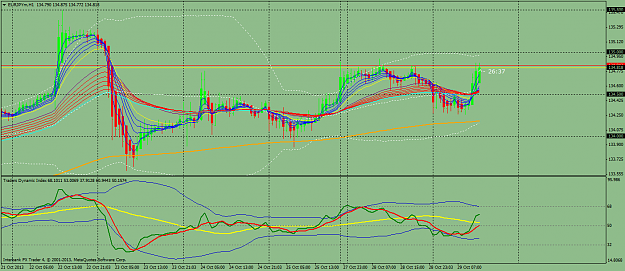
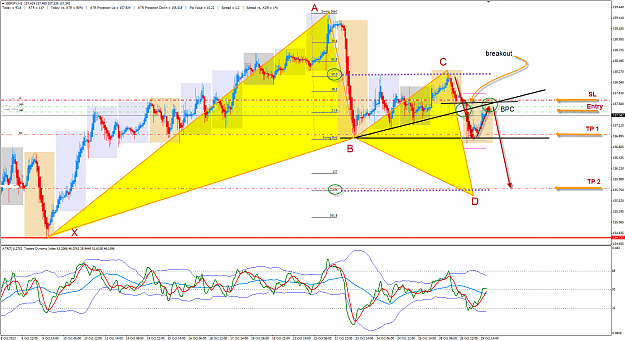
This is a GJ trade i entered today. Try to understand the process behind the trade.... As you can see, i didnt took the trade because of TDI. I took the trade because of the setup. Then i went to 15TF, saw a red candle, with TDI cross, with bearish divergence and pulled the trigger. now its time to wait for the 1H timeframe to confirm that price will continue in my direction. {image}
Ignored
Funny I was thinking same thing it's come back to the 50% fib of last move down, I also saw the divergence on the 15min!
I am just waiting for the first LH on 15min for entry!
Target the same 155.80!
Best of luck mate
Give yourself a chance and trade it like it's layed out...
{quote} Funny I was thinking same thing it's come back to the 50% fib of last move down, I also saw the divergence on the 15min! I am just waiting for the first LH on 15min for entry! Target the same 155.80! Best of luck mate
Ok this method is insane. Now im in the swing of it Im going to pull a 50% acount increase off this month I can see why Eelfranz said buy a golden wheel barrow for the pips! Im not even risking much or doing anything outside the method, just tradeing when the signals align on the 4 and 1 hour charts takeing into acount supports/resistances and fundementals.
I had modest expectations starting this system and so far its blown me away.
Now I dont expect to increase my acount 50% every month thats unrealistic ( I think) but just 2-5% would put a smile on my face
But so far im getting a 8/10 -9/10 sucess rate.
One tip even though Im a noob still that I found increased the pass rate was once you make a trade leave it, dont sit there looking at the charts, go off do something else and only check on the next broker update. That helps remove any fear/greed problems. Just let your take profit, stop loss and trailing stops do the work that what they are there for.