DislikedHello Snarlyjack & other tdi-pro's here, I've allready read about the first 3.000s posts, so not all at least, even not many of the latest ones. So I apologize if this question was answered in the past. I try to follow this system on H4 since 2 weeks actively on a demo-account and now I'm struggling a little while trading the system in realtime. Why? As others I was looking on the past chart to learn and identify the entry and exit opportunities. But they do not show the same picture that I have in the realtime trading. On the change to a new candle...Ignored
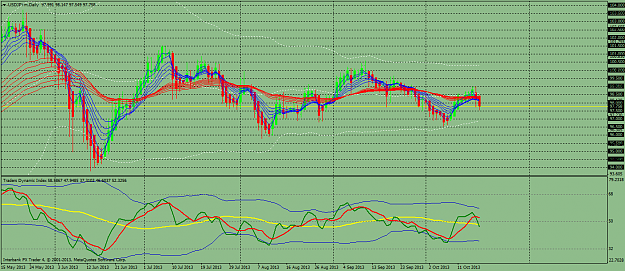
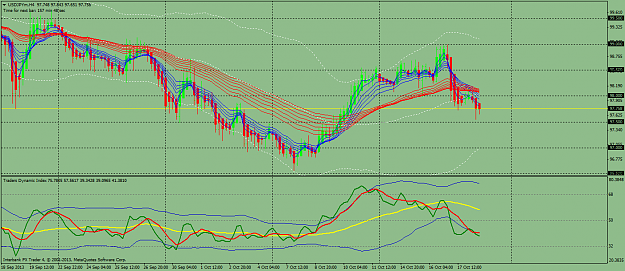
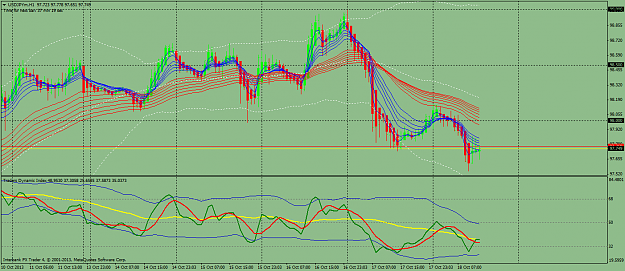
Your observations on the TDI is correct. I made several posts on this TDI behaviour not exactly re-painting but the TDI calculates the PL, TSl and MBL using the RSi close price. So any valid signal is only good after a candle closed.
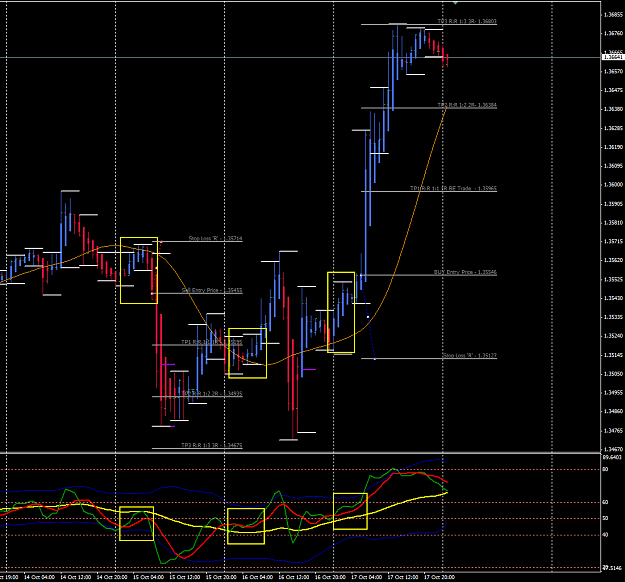
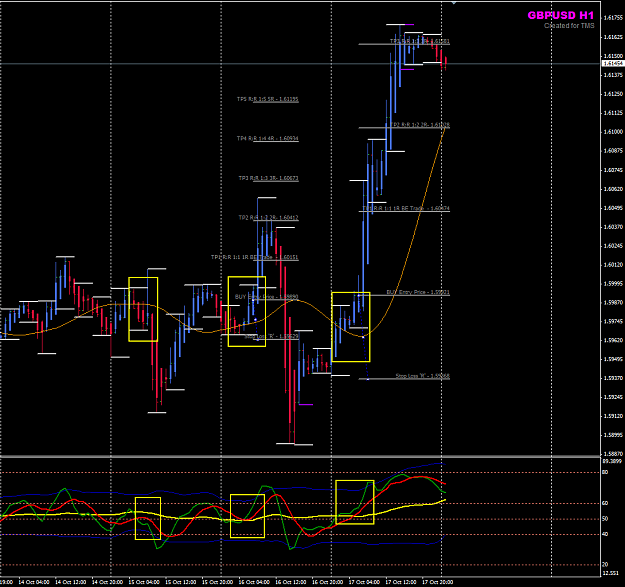
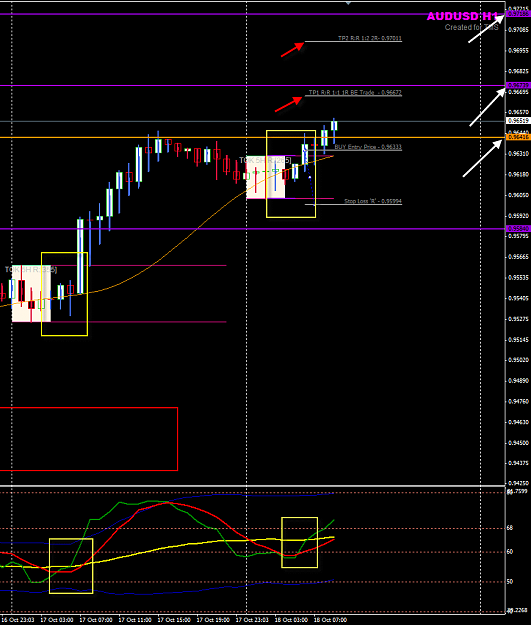
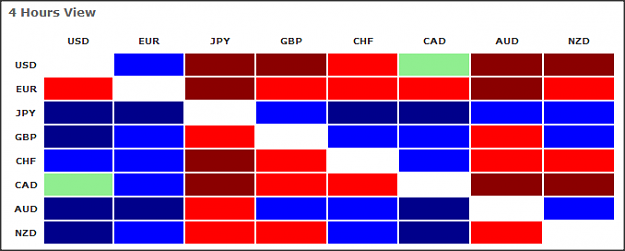
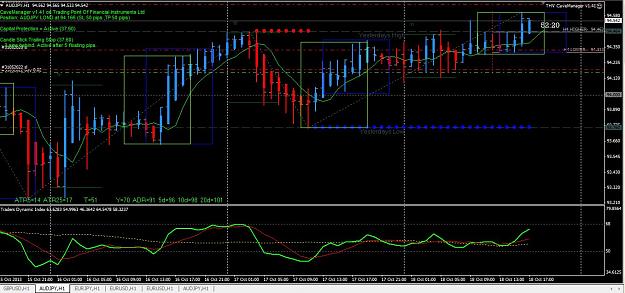
All the charts posted here in this thread are history charts and the TDI had been refreshed when the traders post their charts and the realtime TDI may be different from the one posted with refreshed TDI data.
If you are interested to study more into the TDI I recommend you look up the work by John Hayden who did good study into the RSI trading systems. He authored several books:
1) RSi: the Complete Guide
2) The 21 Irrefutable Truths about trading.
Here in TMS, we use the TDI for confirming the Price Action. But there is another unqiue feature 'secret' of the TDI which we must exploit, i.e. the trend of the relative strength index aka RSI of the price. When both the Price trend and the TDI trend are in synergy, this is when most of the breakouts trades run. The TDI is made up of 3 moving averages of the RSI(13) - a 2 Simple MA of the RSI(13, close), a 7 SMA and a 34 SMA of the same RSI(13, close). Think of this!
Based on the market type, we can fine tuned the TDI with a RSi (period 8, typical) and this will give us a more responsive TDI according to the most recent volatility of the price.
regards,
EMMANUEL
A
Honesty is a very expensive gift. You wont find it in cheap people.WBuffett