Introduction of T4F template This template can be used to know when the trend is going to change and where will be the target? Its easy to understand and I have described in the pictures . The length of the phase is 220 pips . Its derived from T4Y template. I love this template. This time I have an example about GOLD. So when you want to set the Size in the setting of indicator, use 2200 to draw phases. (Its only for GOLD) Rule: When price falls below 61.8% , or rises above 38.2% , it should continue to reach 23.6% or 76.4% respectively and to happen...
Ignored
Hi Boby,
how many pips should the price break the 61,8% / 38,2%?
If it breaks, when do we know, price will not turn back to the 100% level?
Bobi, or someone else who has the answer, can you tell me will P3 still be updated monthly for the use in those very good tools PicvotCalculator V1 and Swirls?
I hope so!
First, let me congratulate you on your excellent work.
I have read the thread from the onset, and I think that the best way to use your trading system,
is based on daily graphs with a range of 965 pips.
I want to ask you this:
1. The template for day graphs, corresponds to the Plantilles Abonacci Instruccions
v7.0.ex4, in post # 4. Is it right?
2. You can share the formula to calculate the baseline?.
This is essential for the proper functioning of your system.
I want to express my admiration for your system and want to communicate that I'm working on developing
Excel application, trading journal + Dashboard built, which I share when completed.
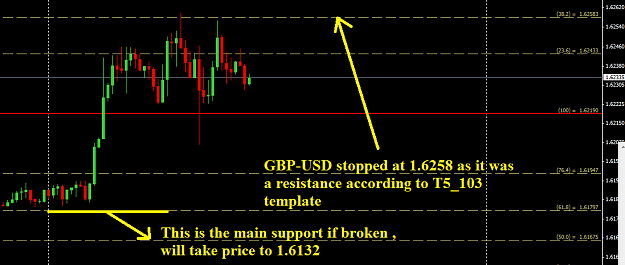
Introduction of T5_103F Template Its time to introduce one of the templates that is very useful for short-medium term trading. Length of each phase= 103 pips RULE: Break of 38.2% Level -------> Target 47 pips Break of 61.8% Level -------> Target 47 Pips We can say 38.2% is broken when price is traveling from 76.4% of lower phase and rises 7 pips above 38.2% level of current phase. We can say 61.8% is broken when price is traveling from 23.6% of upper phase and falls 7 pips below 61.8% level of current phase. The baseline and the template are valid...
Ignored
Hi Boby,
I'm new here. I ave read through the thread and can't find the download link for any of the said templates. Can someone help me out here please thanks
Hello
Good work! I think you can easily find the breakout areas ahead of every movement . Good think of that is that its clear and constant up to end of the year .
See how market respected to the resistance that has been determined in the first day of the year . I hope, I have been able to change your idea of trading and the real concept behind market movement.'
{quote} Hi Boby, how many pips should the price break the 61,8% / 38,2%? If it breaks, when do we know, price will not turn back to the 100% level? Thanks and regards.
Ignored
Hi
1- for template T5_103 , its 7 pips to be said broken.
2- Depending of T5_103 , you can not know , you should use other templates along it with proper use of money management.
Hi Aebab, First, let me congratulate you on your excellent work. I have read the thread from the onset, and I think that the best way to use your trading syst
2. You can share the formula to calculate the baseline?. This is essential for the proper functioning of your system
Ignored
If you read this thread did you read the part where bobi can't reveal his formula cause it's sold and rightfully owned by his company?
bobi - sorry I haven't got back to your last post. Pretty busy with work here. I will compile some old documentation which I believe is outdated and would appreciate if you could correct this in relation to he current templates. Would it be possible to get template 3 baselin for this month?
Hi Aebab, First, let me congratulate you on your excellent work. I have read the thread from the onset, and I think that the best way to use your trading system, is based on daily graphs with a range of 965 pips. I want to ask you this: 1. The template for day graphs, corresponds to the Plantilles Abonacci Instruccions v7.0.ex4, in post # 4. Is it right? 2. You can share the formula to calculate the baseline?. This is essential for the proper functioning of your system. I want to express my admiration for your system and want to communicate that...
Ignored
Hi
Welcome.
Some templates can not be drawn daily . As price movement and the destiny of the market is determined in the first day of the year.
So if you like to be successful , you should you monthly generated templates like T4Y, Traditional T4, T3 along with annual templates .
The formula is my company property and can not be shared. Even if it was possible to share , you could not use excel to have a calculator to generate the templates as its not a simple formula. Lots of C++ classes have been developed to calculate the base lines .
The movements and fluctuations of the markets are due to different rooms and phases as I said previously. I have just come up here with 5 templates . There are at least 64 templates for each pair that can be used to detect the future movements of the market from 1 day to 5 years . For example , I have a template called T16_1800 that is suitable to know what will happen to one pair,stock in next 1-2 years . Or another template that can be used for the shorter time with 400 pips of profit . Its phase length is 900 pips. If I am not posting more templates , I do not want to make you confused as these templates are useful for long-term traders and even for bankers and Governments . For example , according to template T16_1800 , EUR/USD will move to 1.4455 in the next year.
{quote} yes I have . But really useless. How you wanna take pips for 50 pips templates in length?! Anyway , I will show you how to use some of templates for short term later.
Ignored
Hi Bobi
You mentioned that you will show how to use some templates for short term trades yesterday please can you show that today.
{quote} Hi. I'm new here. Where can I download Template T3 and Template T4Y? Can help me please.
Ignored
if you look on page 1 - bobi has posted an indicator which allows you to input base lines into the indicator and it'll create a template for you... follow his instructions.. works a charm
{quote} if you look on page 1 - bobi has posted an indicator which allows you to input base lines into the indicator and it'll create a template for you... follow his instructions.. works a charm
Ignored
Thanks for the quick response.
Indicator which is attached for a long period.
I realized that T3 is for a short period
What is the value in pips to be input for a short period.