Hi there,
I would be very grateful if anyone could help me with modifying this indicator
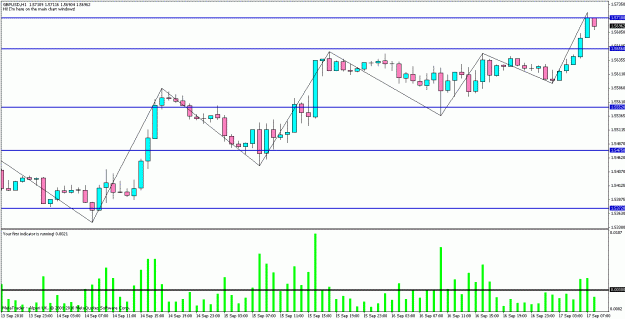
This indicator shows a bar denoting the size of each candle on a chart. So if you were looking at an hourly chart and the candle started at 10.00am and finished at 11.00am and the range of the candle was 30 pips the indicator shows a bar with a value of 30. It plots the indicator bar in real time so as the candle increases in size the bar increases accordingly
I want to be able to adjust the colours of the bars at predetermined values. So for example I would be able to do the following:
a) A bar with a value between 0 and X (you can determin what value to assign to X) is colour 1
b) A bar with a value between X and Y (you can determin what value to assign to Y with X being the same value as in a) above) is colour 2. So as soon as the value goes above X the bar changes colour (I am using 5 decimal points)
c) A bar with a value between Y and Z (you can determin what value to assign to Z with Y being the same value as in b) above) is colour 3. So as soon as the value goes above Y the bar changes colour (I am using 5 decimal points)
I find that this indicator works well in showing momentum coming into the market particularly when you have a bar value much greater than the preceeding bars. Below there is a picture of the indicator and the indicator itself
I would really appreciate someones help
Many thanks
Attached File(s)
