|
Joined Jun 2013
|
Status: Trading as a Hobby
|504 Posts
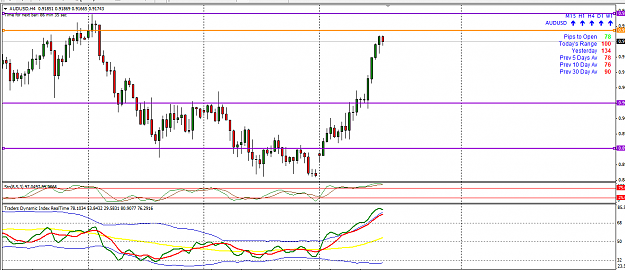
the AUD/USD is at a weekly resistance zone and just bounced off the weekly fib 181%. the stochs are in the overbought area. so do you think that the tomorrow trade balance create the push up or the pull down...watch out for it!
{quote} thats the exact reason i am posting my charts. need to learn from you guys a lot
Ignored
I think you will learn a lot more if you first study the babypips school very thoroughly. You need to learn a lot of the basic stuff first before you can start trading. Really, it takes a lot of time, but this is the best thing you can do. You can ask all the basics here, but that's not the way to learn well.
Hi,
3 good trades today, placed in the morning. Following the rules paid once again!
I was wondering if someone could suggest/share a quality book on psychology of trading(other than "Trading in the zone")? I'm concerned on this as I am preparing to open a live account...will the demo acct. success sustain?
{quote} Farhad, Can you please post that support and resistance indicator.
Ignored
Hi tixy;
I don't use any indicator for supp/Res.
I myself recognize them and then draw it by Horizontal line. ( It is simple by looking at the charts ) I think that the indicator in my pic isn't a good one and I try not to use them any more! You can practice more to find them by yourself!
But u can use the indicators in attachments and also that one gsbharaj attached.
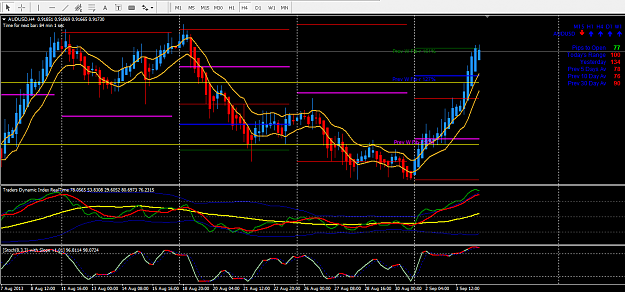
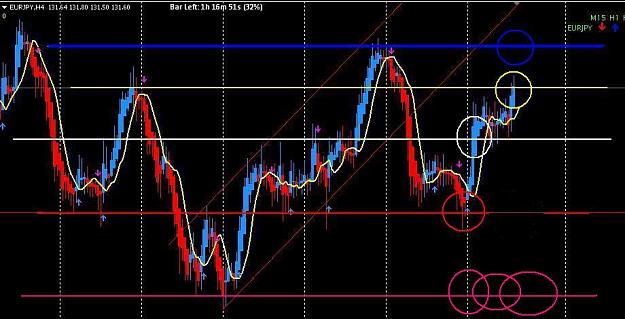
When the candles Goes out of the Channel then u should expect that it goes to nearest supp or Res ( to appear a change of polarity condition ) HORIZONTAL RED LINE If break it's target is PINK LINE
Then if PA couldn't break it then it pulls back to the target of nearest RES that is WHITE LINE
Then if it breaks, u should expect PA to go toward next RES that is YELLOW LINE
Then if it breaks, u should expect PA to go to BLUE LINE
So if all above didn't occur, Then it goes downward!
{quote} Dear gsbharaj; Look at the pic: When the candles Goes out of the Channel then u should expect that it goes to nearest supp or Res ( to appear a change of polarity condition ) HORIZONTAL RED LINE If break it's target is PINK LINE Then if PA couldn't break it then it pulls back to the target of nearest RES that is WHITE LINE Then if it breaks, u should expect PA to go toward next RES that is YELLOW LINE Then if it breaks, u should expect PA to go to BLUE LINE So if all above didn't occur, Then it goes downward! It is the best way to live with...
Ignored
thank you farhad for the insight....i have put my trading on hold till i become confident about the support and the resistance levels.
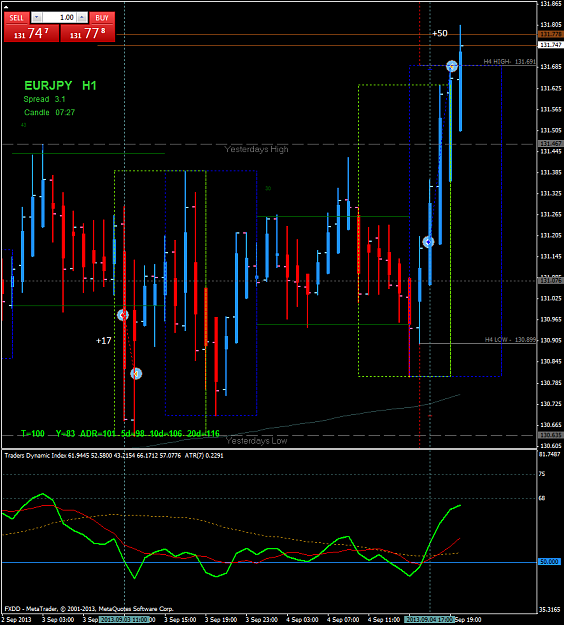
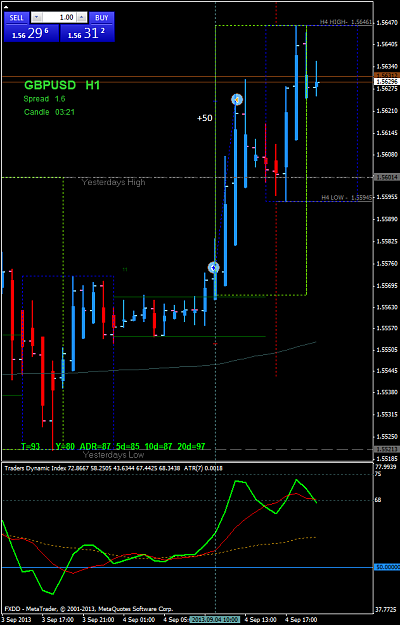
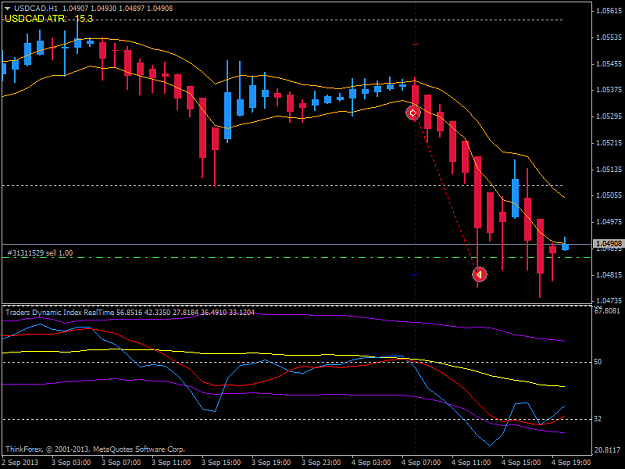
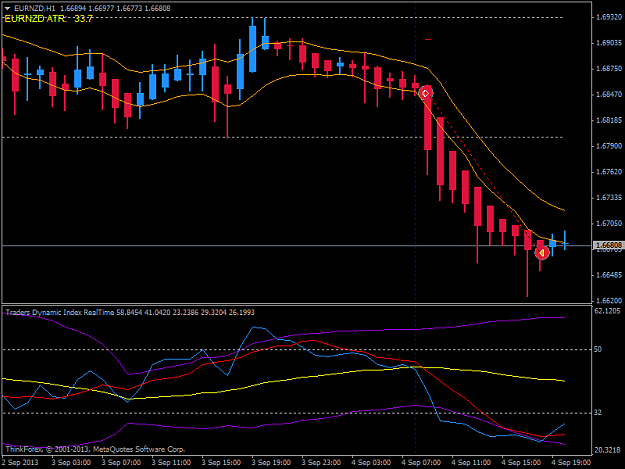
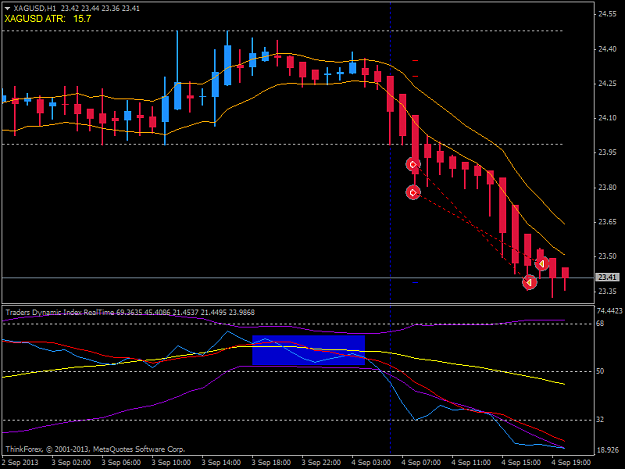
One EJ H1 trade and one GU H1 trade today on live acct......also I am learning the gold market.....had a very nice gold trade on demo.....{image}{image}
Ignored
Inspiring as usual phx62, for the GBP trade, what made you pull the trigger to go long? The tdi was above the MBL and the price did break past the last 10 candles or so, but the candle you entered at was a pullback. In which situations would you consider pullback a reversal signal? Or did you enter during the beginning of the candle and price went up then back down but you decided to stay in the trade?
{quote} Inspiring as usual phx62, for the GBP trade, what made you pull the trigger to go long? The tdi was above the MBL and the price did break past the last 10 candles or so, but the candle you entered at was a pullback. In which situations would you consider pullback a reversal signal? Or did you enter during the beginning of the candle and price went up then back down but you decided to stay in the trade? Thanks
Ignored
I watched the setup candle close above the Asian high with the TDI green over red over yellow. Then at LO, I entered long following the open of that candle. The pullback on that candle occurred after I entered. The trade did not really take off until after the GBP news, an hour an a half after I entered. I was prepared to close the trade if news pushed price down. I had already moved my SL to just below the low of the Asian session. Price continued long, so the TP was hit.
{quote} I watched the setup candle close above the Asian high with the TDI green over red over yellow. Then at LO, I entered long following the open of that candle. The pullback on that candle occurred after I entered. The trade did not really take off until after the GBP news, an hour an a half after I entered. I was prepared to close the trade if news pushed price down. I had already moved my SL to just below the low of the Asian session. Price continued long, so the TP was hit.