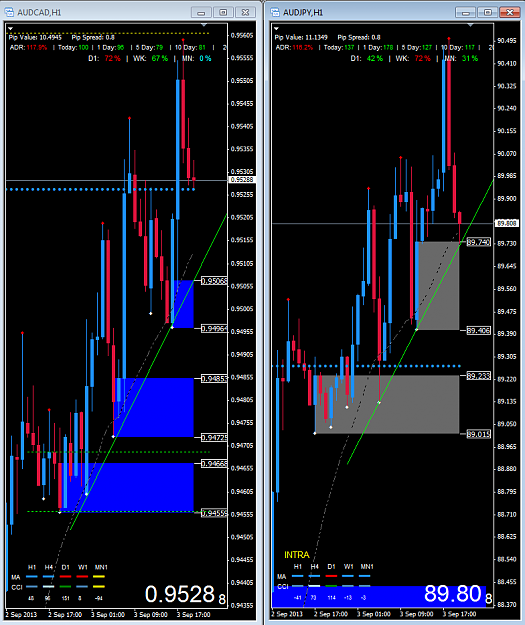
• Home
  • Forums
  • Trades
  • News
  • Calendar
  • Market
  • Brokers
  • Login
  • Join
  • User/Email: Password:
  • 6:57am
Menu
  • Forums
  • Trades
  • News
  • Calendar
  • Market
  • Brokers
  • Login
  • Join
  • 6:57am
Sister Sites
  • Metals Mine
  • Energy EXCH
  • Crypto Craft

Options

Bookmark Thread

First Page First Unread Last Page Last Post

Print Thread

Similar Threads

Price movement as a function of Supply and Demand 43 replies

Supply and demand zones and EW principles 1 reply

How Markets Work, in a Nutshell! 32 replies

Supply and Demand Zones 43 replies

Demand and Supply 1 reply

  • Commercial Content
  • /
  • Reply to Thread
  • Subscribe
  • 5,247
Attachments: Supply and demand in a nutshell by Alfonso Moreno
Exit Attachments

Supply and demand in a nutshell by Alfonso Moreno

  • Last Post
  •  
  • 1 9394Page 959697 486
  • 1 Page 95 486
  •  
  • Post #1,881
  • Quote
  • Sep 3, 2013 8:28am Sep 3, 2013 8:28am
  •  outapips
  • | Joined Mar 2008 | Status: Member | 82 Posts
Quoting panoramia
Disliked
{quote} It was a fresh D1 demand off a monthly fresh demand! I want to trade off brand new fresh D1 demand areas at fresh original monthly demand areas. They are high probabilities! The same as fresh H1 demand areas are good at D1 demand areas. Price is fractal! Alfonso
Ignored
Thanks Alfonso, that is what I missed earlier.
If you act surprised, then you probably missed something
 
 
  • Post #1,882
  • Quote
  • Sep 3, 2013 8:42am Sep 3, 2013 8:42am
  •  pres78
  • Joined Sep 2010 | Status: I'm not here... or am I? | 3,989 Posts
Quoting caparzo
Disliked
{quote} i guess these are the ones that are called BULL and BEAR TRAPS. Just breaking the zone by few pips and then go like a rock to the way which was anticipated before.
Ignored
Exactly. Looking back you even seen case where we form a RBD or a DBR through a zone with the base for at or above / below the distal. These are great because it gets rid of the whole "is the zone still good?" question as we now have a fresh new base to watch. It's those ones that just up or down thrust through the Distal that still feels a bit gray to me.

I am forward and backtesting this to see whether a break of the distal or treating the distal like a trendline where we need either a close or a full OHLC above or below the distal to consider it broken. For now I am making these zones purple while I test this considering Alfonoso's thread rule that a break makes it void.
Today's zone = Tomorrow's opportunity!
 
 
  • Post #1,883
  • Quote
  • Sep 3, 2013 8:45am Sep 3, 2013 8:45am
  •  Reacto
  • | Joined Nov 2010 | Status: Member | 110 Posts
Hello everyone,

Recently I downloaded the indicators build and provided bi Alfonso (many, many thanks). I have placed everything in the respective folders of MT4 (Oanda build 509). The indicators work perfectly, except for the supply zones, they are in the wrong collar, and the collar does not change when the zone is hit. Is anybody familiar with this problem, and more important, does anyone know how to solve it? See attached file.

Best regards, or Un saludo
Attached Image (click to enlarge)
Click to Enlarge

Name: Image1.png
Size: 87 KB
 
 
  • Post #1,884
  • Quote
  • Sep 3, 2013 9:21am Sep 3, 2013 9:21am
  •  Ranagol
  • | Joined May 2013 | Status: Member | 24 Posts
Quoting B. Valk
Disliked
Hello everyone, Recently I downloaded the indicators build and provided bi Alfonso (many, many thanks). I have placed everything in the respective folders of MT4 (Oanda build 509). The indicators work perfectly, except for the supply zones, they are in the wrong collar, and the collar does not change when the zone is hit. Is anybody familiar with this problem, and more important, does anyone know how to solve it? See attached file. Best regards, or Un saludo
Ignored
Hey B.Valk! I'm guessing those zones are manual zones, so you need to change the color for supply/demand manually. The lower zone changed its color from blue to dimgrey so no problem there. The upper zone is supply so you need to manually change the color to brown when drawing the zone. If you change it now, wait for a tick, the zone will automatically change to dark green since it's been hit a few times.
 
 
  • Post #1,885
  • Quote
  • Sep 3, 2013 9:46am Sep 3, 2013 9:46am
  •  Reacto
  • | Joined Nov 2010 | Status: Member | 110 Posts
Tanks Ranagol, works perfectly.

I understand from the way you explain it that this is always the case, is that correct?
I was used to an other indicator witch detected this automaticly, when a rectangle was drawn above current price.

Best regards, Robert
 
 
  • Post #1,886
  • Quote
  • Sep 3, 2013 10:11am Sep 3, 2013 10:11am
  •  Ranagol
  • | Joined May 2013 | Status: Member | 24 Posts
Quoting B. Valk
Disliked
Tanks Ranagol, works perfectly. I understand from the way you explain it that this is always the case, is that correct? I was used to an other indicator witch detected this automaticly, when a rectangle was drawn above current price. Best regards, Robert
Ignored
Yes, for manual zones the rectangle color is always picked manually.
 
 
  • Post #1,887
  • Quote
  • Sep 3, 2013 11:01am Sep 3, 2013 11:01am
  •  Myst1z
  • | Joined Feb 2013 | Status: Member | 107 Posts
Hi Alfonso, just thought I would chip in a little as in a way I can understand Axlz's frustration regarding the subjectivity of zones. While indeed a lot of experience and discretion is required, the following trades which you recently took really baffles me as well.

Attached Image (click to enlarge)
Click to Enlarge

Name: AUDUSD.png
Size: 46 KB


Attached Image (click to enlarge)
Click to Enlarge

Name: euraud.png
Size: 46 KB


For both trades, it wouldn't even occur to me that there was a zone where you took the trades. I get that according to your rules price doesn't need to absorb opposing zones if we are with the trend. However, those zones which you took did not have a strong departure, nor did price move a substantial distance away. I might be wrong but such zones would score pretty bad on the odds enhancers. I've seen this on many previous trades as well, and somehow they mostly worked out well. As such, could you explain why you would even consider those as zones despite the lack of the most important criteria - A strong departure signifying S/D imbalance? Somehow feel that I'm missing out on something which you could enlighten my eyes to, thanks!
 
 
  • Post #1,888
  • Quote
  • Sep 3, 2013 11:30am Sep 3, 2013 11:30am
  •  panoramia
  • | Commercial Member | Joined Aug 2011 | 3,525 Posts
Quoting Myst1z
Disliked
Hi Alfonso, just thought I would chip in a little as in a way I can understand Axlz's frustration regarding the subjectivity of zones. While indeed a lot of experience and discretion is required, the following trades which you recently took really baffles me as well. {image} {image} For both trades, it wouldn't even occur to me that there was a zone where you took the trades. I get that according to your rules price doesn't need to absorb opposing zones if we are with the trend. However, those zones which you took did not have a strong departure,...
Ignored
Hello Myst!

Thanks for your comments. I understand everybody's frustration, I had that frustration for a long time until I found a way that works for me. I backtested these kind of entries and they work most f the times, so I am taking all of them as they happen under certain conditions. No matter what I say or do, that means nothing if you don't do the proper backtesting and foward testing, that will show you that whatever you are trying to prove is working or not.

Most SD traders tend to look for strong imbalances, I do as well, I LOVE nice departures, I WANT strong departures.

But I think we're forgetting something very important here:

  1. Market dynamics. What the market is telling you RIGHT NOW
  2. Location. How high or low u are in the curve. If there is still room to previous opposing higher timeframe SD areas
  3. Demand being respected and supply being violated (uptrend), opposite for an uptrend

This is my rationale for those 2 trades and most of my trades:

AUDUSD chart:

  1. Demand is being respected all the way up from the D1 demand zone off the Monthly weekdly speedbump zone
  2. What do I want do in those circumstances on my entry timeframe? In this case, H1? I want to buy all the imbalances that I see, unless either demand begins to be violated or the current valid ascending trendline is solidly broken
  3. You may think that they are small imbalances, I love big imbalances and strong departures, but sometimes brand new pile or orders accummulating are not that obvious
  4. That H1 demand area was painted by the automatic SD indicator. I trust this simple indicator when trading with the trend. It uses old zig-zag indicator to detect levels, it's the most commonly used SD indicator as far as I know. I have forward tested that it just works a high percentage of times under these circumstances, so why not taking those trades that I know that works? I just take them
  5. Location: AUDUSD is low in the monthly curve, I don't want to sell there, I want to buy
  6. That is the simple rationaline behind it

    You have to have the topdown analysis done, and based on location (how high/low in the curve you are), and how demand/supply is being respected, take trades in one direction or the other

EURUAD chart.

  1. Location: we're high in the WK supply curve, price is reacting to the weekly supply and removing previous demand. Lots of room to drop
  2. Demand is being violated all the way down off WK supply, supply is being violated
  3. My descending trendline is being respected, priting new lows with every small supply area being formed on my entry timeframe (H1)
  4. Last week low (red beads), solidly broken
  5. What do I want do in those circumstances on my entry timeframe? In this case, H1? I want to sell all the imbalances that I see
  6. Why should I wait for price to go higher than last week low? That would mean weakness in that market, and I don't see that, I see the opposite
  7. If the imbalance is great, then I will trade is as well, but if new lows are being printed, new supply areas are being formed and lots of room to opposing higher timeframe areas, why should I wait for price to go higher to sell?

Like I said, it works for me, that's the simple rationale, it has logic for me. I love big imbalances, and I will trade all of them as well, as long as they match the set of rules on my way of trading. If the H1 SD areas start to be taken out or the TL is broken, then I will no longer look to keep on trading in the same direction, I will resume shorting it IF lowest lows are taken out and new levels of supply are being created once that happens.


  1. If I lose my trend on H1, and still high in the curve like the EURAUD. Then I will check the H4 chart and see if the trend is still there to keep on selling on H4
  2. If that happens, then I will happily go short on H4. If the trend on H4 is also broken, then I will wait for original levels at fresh D1 supply areas to short again or latest demand in control being broken

That's all. It may buffle you and others, it may seem illogical to you, but it's not to me. Location, location, location and current market dynamics, what the markets are telling you.

This is what I am trying to put forward on this thread. Hope it's getting clearer, but I know it takes time.

Again and again, and again. Don't believe what I say, do it yourself. Take the time to forward test many currency pairs doing exactly this, and you will see by yourself. I am not the one to tell you what to do or not to do, you have to see it with your own eyes, forward test it and after some good amount of time, eventually trust in what you backtested and trade live, it can be this SD strategy or a Zodiac Signs combined with EMA crosses, it does not matter. It's all based on your trading plan and set of rules

Sorry again if I didn't explain correctly, but it's not easy at all to do it since each of you has different backgrounds and experiences on trading. Doing my best, but maybe I am not doing as good as you all were expecting. It has to make sense to you and you have to test what I say, don't believe in me, just do it yourself and the markets will tell you.

Alfonso
P.S. I will talk about these matters extensively in the next webinar this week, hopefully all doubts will be cleared with all the examples shown

Set and Forget supply and demand trading community
 
 
  • Post #1,889
  • Quote
  • Sep 3, 2013 11:52am Sep 3, 2013 11:52am
  •  caparzo
  • | Joined Aug 2013 | Status: Member | 58 Posts
you are doing great job Alfonso and i am learning alot of things from you especially about having strict rules and tradind plan.
and more importantly about psychology of trading.
thanks again my friend
 
 
  • Post #1,890
  • Quote
  • Sep 3, 2013 12:02pm Sep 3, 2013 12:02pm
  •  sebkor6
  • | Joined Jul 2013 | Status: Member | 132 Posts
Hi,

attached eur jpy sell.
Daily supply in controll.
On h4 we have nice speedbump.
I drilled to h1 to find new, fresh and original supply level.

Always the same way of trading.
Attached Images (click to enlarge)
Click to Enlarge

Name: eur jpy d.PNG
Size: 100 KB Click to Enlarge

Name: eur jpy h4.PNG
Size: 101 KB Click to Enlarge

Name: eur jpy h1.PNG
Size: 85 KB
 
 
  • Post #1,891
  • Quote
  • Sep 3, 2013 12:14pm Sep 3, 2013 12:14pm
  •  caparzo
  • | Joined Aug 2013 | Status: Member | 58 Posts
Hi guys
On gold,
we are bouncing from Daily demand zone along with the Daily trend.
we had a H1 zone below but never reached there,
now i am looking to go long on H1 speedbumb.
let's see...
Attached Images (click to enlarge)
Click to Enlarge

Name: gold D1.png
Size: 37 KB Click to Enlarge

Name: gold H1.png
Size: 44 KB
 
 
  • Post #1,892
  • Quote
  • Sep 3, 2013 12:16pm Sep 3, 2013 12:16pm
  •  bobyv87
  • | Joined Feb 2012 | Status: Member | 181 Posts
Quoting panoramia
Disliked
{quote} Hello Myst! Thanks for your comments. I understand everybody's frustration, I had that frustration for a long time until I found a way that works for me. I backtested these kind of entries and they work most f the times, so I am taking all of them as they happen under certain conditions. No matter what I say or do, that means nothing if you don't do the proper backtesting and foward testing, that will show you that whatever you are trying to prove is working or not. Most SD traders tend to look for strong imbalances, I do as well, I LOVE...
Ignored

Alfonso, i think this is the best explanation from this thread for me. Now i think i understand supply and demand, but especially confirmation trades, which gave me headaches until now. Thank you!
 
 
  • Post #1,893
  • Quote
  • Sep 3, 2013 12:34pm Sep 3, 2013 12:34pm
  •  Nametaker
  • | Commercial Member | Joined Jan 2013 | 206 Posts
Quoting sebkor6
Disliked
Hi, attached eur jpy sell. Daily supply in controll. On h4 we have nice speedbump. I drilled to h1 to find new, fresh and original supply level. Always the same way of trading. {image} {image} {image}
Ignored
Damn mine missed by half a pip

Attached Image (click to enlarge)
Click to Enlarge

Name: eurjpy h1.png
Size: 98 KB


Nick
Take The Path Of Least Resistance!
 
 
  • Post #1,894
  • Quote
  • Sep 3, 2013 12:35pm Sep 3, 2013 12:35pm
  •  sebkor6
  • | Joined Jul 2013 | Status: Member | 132 Posts
Quoting caparzo
Disliked
Hi guys On gold, we are bouncing from Daily demand zone along with the Daily trend. we had a H1 zone below but never reached there, now i am looking to go long on H1 speedbumb. let's see... {image} {image}
Ignored
Hi caparzo.

here is my gold daily picture.
I think that we should look out for this new fresh (but is it original? stiil have this problem) supply zone. If price will reach this level before your speedbump, your setup will be no longer valid, if the price will respect this level on lower TF.
Attached Image (click to enlarge)
Click to Enlarge

Name: gold d.PNG
Size: 86 KB
 
 
  • Post #1,895
  • Quote
  • Sep 3, 2013 12:41pm Sep 3, 2013 12:41pm
  •  caparzo
  • | Joined Aug 2013 | Status: Member | 58 Posts
Quoting sebkor6
Disliked
{quote} Hi caparzo. here is my gold daily picture. I think that we should look out for this new fresh (but is it original? stiil have this problem) supply zone. If price will reach this level before your speedbump, your setup will be no longer valid, if the price will respect this level on lower TF. {image}
Ignored
Hi sebkor,
Thanks for your view on gold, i will keep an eye on that supply level.
 
 
  • Post #1,896
  • Quote
  • Sep 3, 2013 1:12pm Sep 3, 2013 1:12pm
  •  Ranagol
  • | Joined May 2013 | Status: Member | 24 Posts
Quoting sebkor6
Disliked
Hi, attached eur jpy sell. Daily supply in controll. On h4 we have nice speedbump. I drilled to h1 to find new, fresh and original supply level. Always the same way of trading.
Ignored
Hi Sebkor, I missed that trade because for me it's the daily demand in control with that 89 pip level on my chart (130.176-129.285). Why didn't you consider that zone as demand? It took out supply (131.371-131.919) even if that was only a reaction to a previous supply level (131.803-132.700). Or am I seeing too much into the chart? Could you please explain?

Attached Image (click to enlarge)
Click to Enlarge

Name: eurjpydaily.png
Size: 67 KB
 
 
  • Post #1,897
  • Quote
  • Edited at 1:39pm Sep 3, 2013 1:14pm | Edited at 1:39pm
  •  panoramia
  • | Commercial Member | Joined Aug 2011 | 3,525 Posts
Arrived home now! No turbulances crossing a bit of the atlantic ocean (Canary Islands)!

I just wanted to show you another live example I got triggered while flying, based on what I mentioned in my previous post regarding the AUDUSD trade and what type of levels I am looking for, going long on all levels of demand when none have been broken and the trendline is being respected. I had the AUDUSD set to buy all new H1 demand areas, so that's what I am doing till it proves me the opposite. It's now a bit over-extended, but rules allow me to buy, so that's what I did, that's all I need to know.

If the first trade (breakeven) at previous H1 demand was still alive, this would have been a scale in. I am protected now, so whatever happens happens. This might be another breakeven because last week high is being respected, it was overshot but not solidly broken, but you never know! I am just following my rules. There is GDP news for the aussie tonight, that high might be solidly taken out and provide new long opportunities. We're still low in the monthly curve.

Attached Image (click to enlarge)
Click to Enlarge

Name: Screenshot1.png
Size: 114 KB


As you can see on AUDJPY and AUDCAD, there were similar opportunities. AUDCAD didn't provide any pullback. But AUDJPY did, and that's why I am long on AUDJPY, I showed you this morning.

Attached Image (click to enlarge)
Click to Enlarge

Name: Screenshot2.png
Size: 71 KB


As you can see on my AUDJPY H1 long on my H1 acount, I don't have H4 or lower than H1 timeframes buttons available at the toolbar, or they will distract me.
Attached Image (click to enlarge)
Click to Enlarge

Name: Screenshot3.png
Size: 150 KB


Alfonso
Set and Forget supply and demand trading community
 
 
  • Post #1,898
  • Quote
  • Sep 3, 2013 1:21pm Sep 3, 2013 1:21pm
  •  panoramia
  • | Commercial Member | Joined Aug 2011 | 3,525 Posts
I was also triggered short on H4 supply on AUDNZD.

The kiwi (NZD) is dropping, but the aussie is strong (I am long) even though a bit over-extended, and tonight there is GDP news for the aussie... Let's see what happens with this short trade on AUDNZD. I am in, so now I can't do anything but see if it works or not!

Alfonso
Attached Image (click to enlarge)
Click to Enlarge

Name: Screenshot2.png
Size: 110 KB
Set and Forget supply and demand trading community
 
 
  • Post #1,899
  • Quote
  • Edited at 2:40pm Sep 3, 2013 1:49pm | Edited at 2:40pm
  •  M.4.x
  • | Joined Aug 2013 | Status: Member | 12 Posts
Hi Alfonso,

Here's my EURNZD trade, still going.
I have 2 questions:
- Is the speedbump at 1.6941 good place to add another short?
- re. AUDNZD I thought you did not trade this pair?

many thanks
Max
Attached Image (click to enlarge)
Click to Enlarge

Name: EN.JPG
Size: 148 KB
 
 
  • Post #1,900
  • Quote
  • Sep 3, 2013 1:58pm Sep 3, 2013 1:58pm
  •  sebkor6
  • | Joined Jul 2013 | Status: Member | 132 Posts
Quoting Ranagol
Disliked
{quote} Hi Sebkor, I missed that trade because for me it's the daily demand in control with that 89 pip level on my chart (130.176-129.285). Why didn't you consider that zone as demand? It took out supply (131.371-131.919) even if that was only a reaction to a previous supply level (131.803-132.700). Or am I seeing too much into the chart? Could you please explain? {image}
Ignored
Hi Ranagol.
For me this demand zone was not that strong because of to much trading on that level.
This trade was not that clear and obvious because price wasn't able to create higher highs and absorbe the upper supply level to clear out the situation.
We should remember that if you have any doubt to take a trade - don't do it. It's better to wait for clear setups, when price creates HH in uptrend or LL in downtrend, and wait for correction to fresh sup/dem levels on lower tf.
Attached Image (click to enlarge)
Click to Enlarge

Name: eurjpydaily.png
Size: 65 KB
 
 
  • Commercial Content
  • /
  • Supply and demand in a nutshell by Alfonso Moreno
  • Reply to Thread
    • 1 9394Page 959697 486
    • 1 Page 95 486
0 traders viewing now
  • More
Top of Page
Forex Factory Blog Updated: Alerting All Members
  • Facebook
  • Twitter
About FF
  • Mission
  • Products
  • User Guide
  • Media Kit
  • Blog
  • Contact
FF Products
  • Forums
  • Trades
  • Calendar
  • News
  • Market
  • Brokers
  • Trade Explorer
FF Website
  • Homepage
  • Search
  • Members
  • Report a Bug
Follow FF
  • Facebook
  • Twitter

FF Sister Sites:

  • Metals Mine
  • Energy EXCH
  • Crypto Craft

Forex Factory® is a brand of Fair Economy, Inc.

Terms of Service / ©2022