Disliked{quote} All right. I agree. I just compare your PA, with analysis of Gann. Once the price movement be obtained, I can analyze it. Previously, it was difficult because there are many lines.Ignored
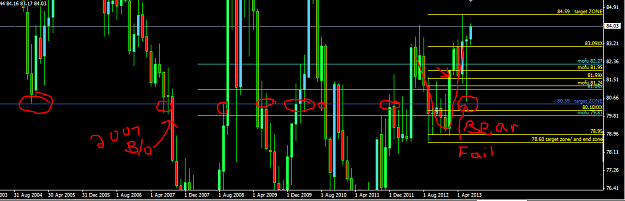
this will not be seen on the eu yet. the people looking at a eu chart alone would have not seen this. most pairs have weakened verse the usd. the euro has remained strong verse most pairs even as it dropped 500 + eu pips. . so the rubber band is stretched. the candle is inside, and anyone who knows candles will ignore that bullish hammer.. 2007 led to 2008 crash.. that level is where that cross accrued. at that time we were having problems getting below 4015.. as this was happening the usd was gaining strength across other pairs. with much lower targets on those pairs at the time. what has changed now is energy.. even if energy rises, its less burden today then it was in 2008 for the u.s. since much more is produced here over 2008. that gets counted twice, it adds to gdp and reduces deficit. it also produces jobs and makes manufacturing cheaper. cheaper manufacturing produces more jobs. Good for the usd = bad for the others. a top on a 40+ year trend.
Attached Image (click to enlarge)
those who can, do. those who cant, talk about those who can