DislikedI have no idea but the H&S pattern could still be in play. If this indeed is a C-wave, one more high > 1.3330/40 is the 61.8 fib. Time and NFP will show. {image}Ignored
Further indication that we "could" turn south from nearby levels.
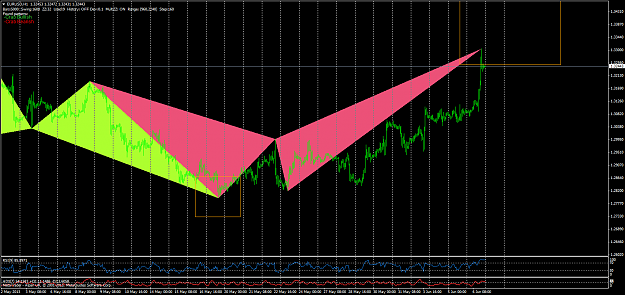
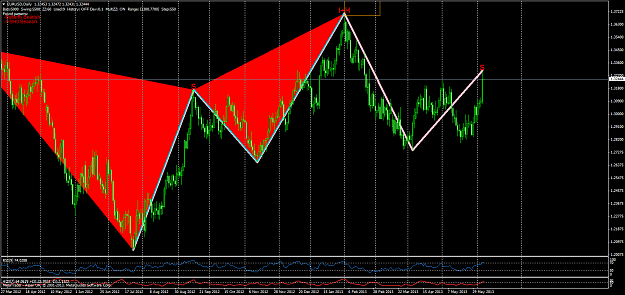
My Butterfly/crab & H&S software spotted these patterns today. Again, I have no idea if this will play out, but will look for sell setup at the 3330/40 area.
Daily chart, H&S detected:
Attached Image (click to enlarge)
Hourly chart, Bearish crab:
Attached Image (click to enlarge)