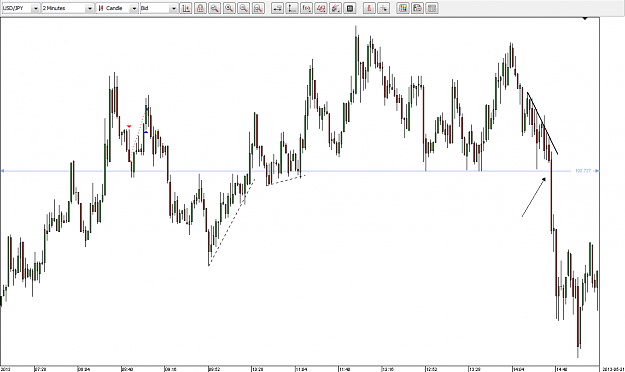
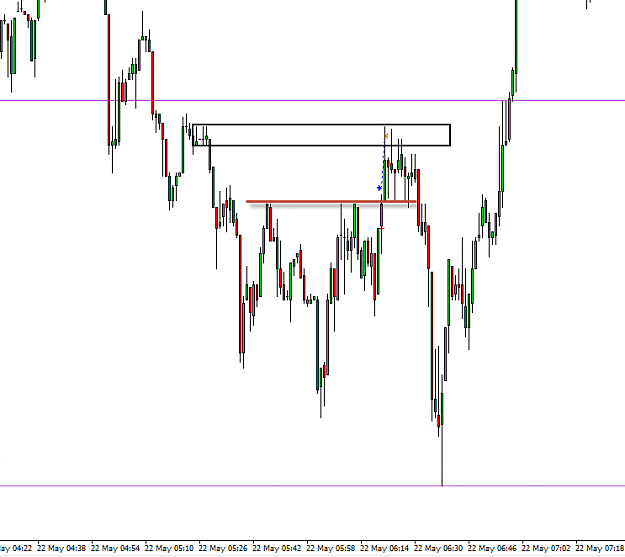
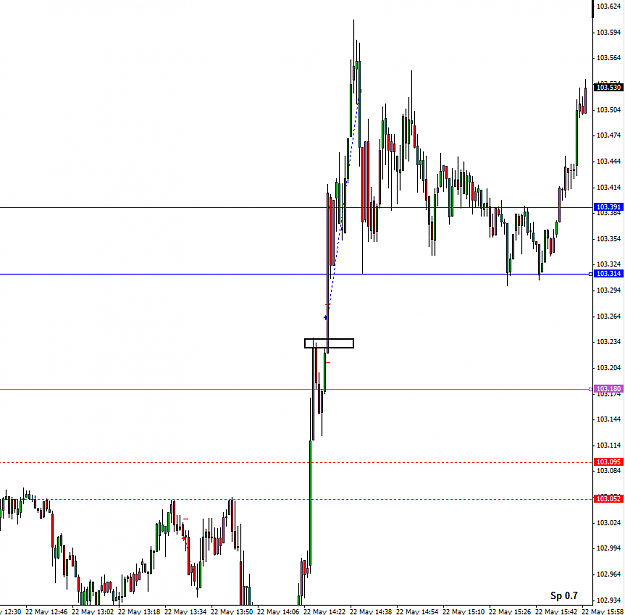
Trade 4: +1.79R
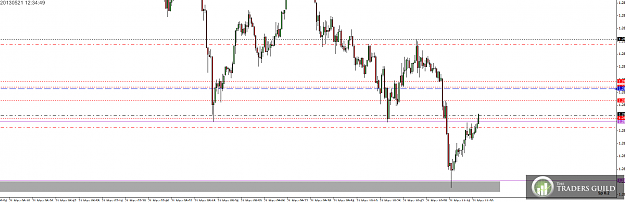
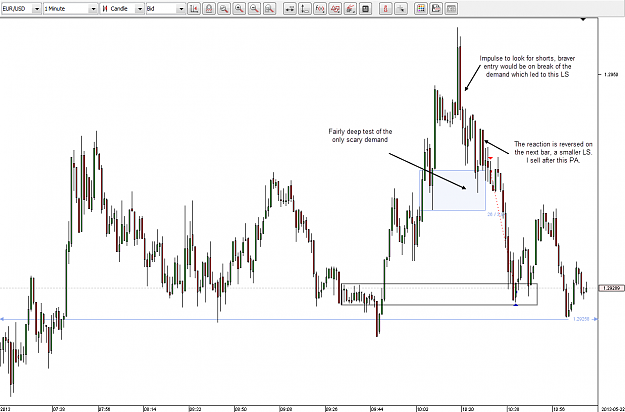
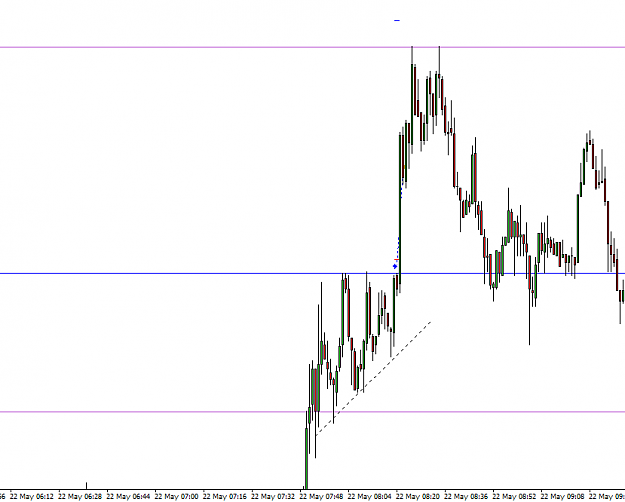
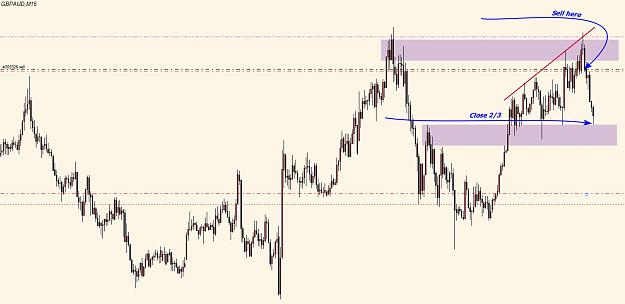
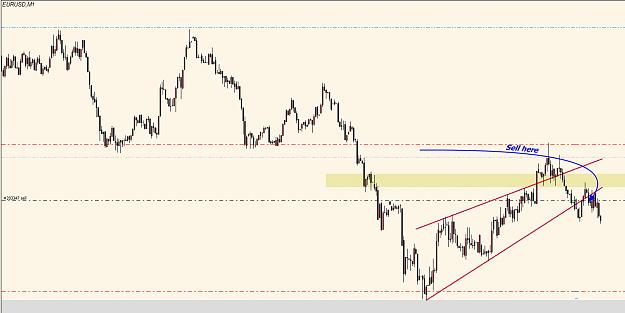
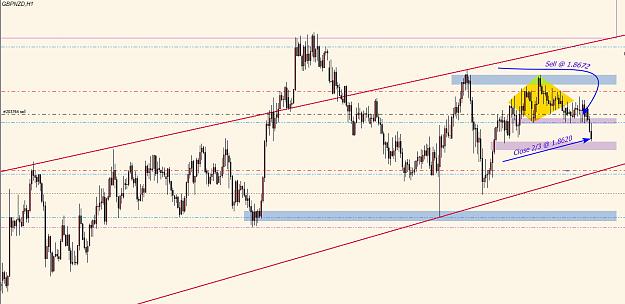
Anticipating a breakout above supply.
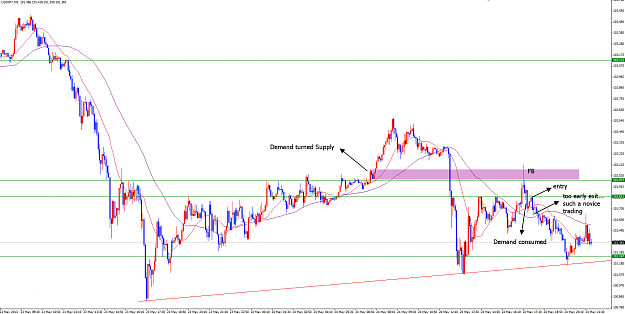
It may look like I'm going long straight into supply here but I'm not as the PA told me that the supply was likely consumed.
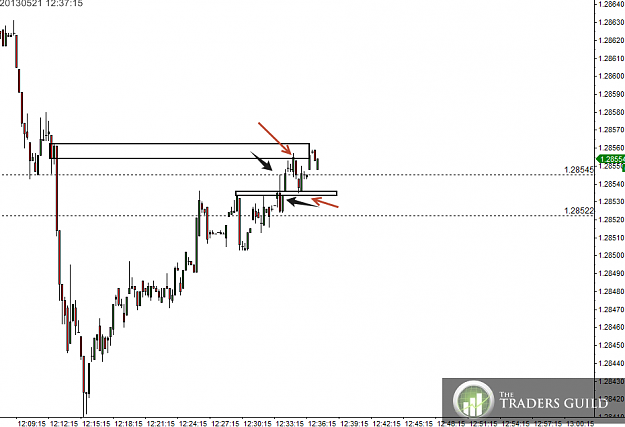
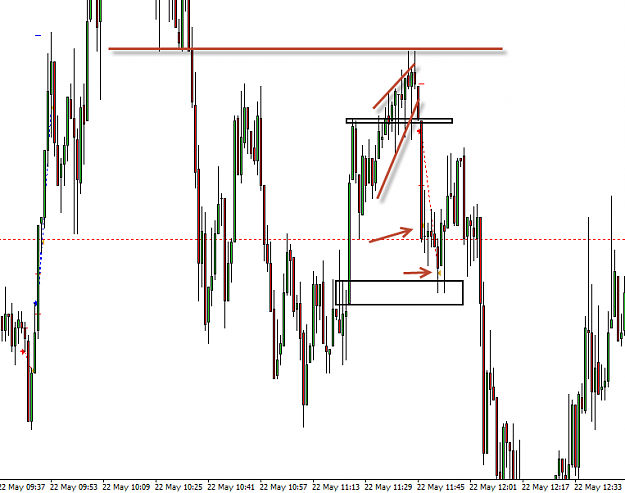
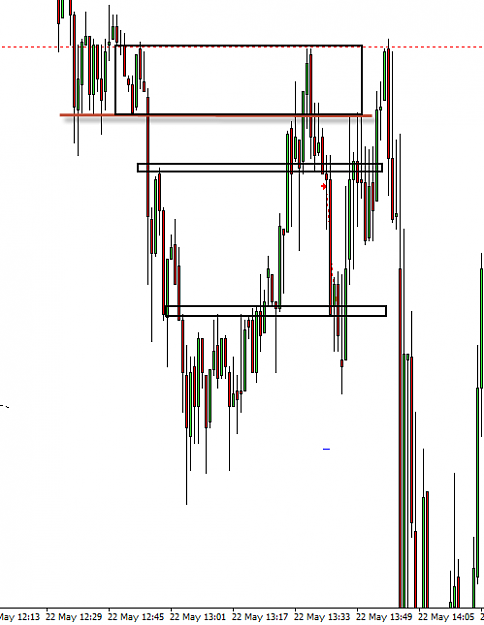
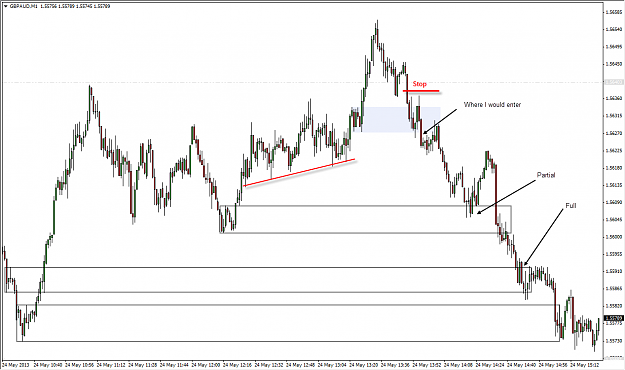
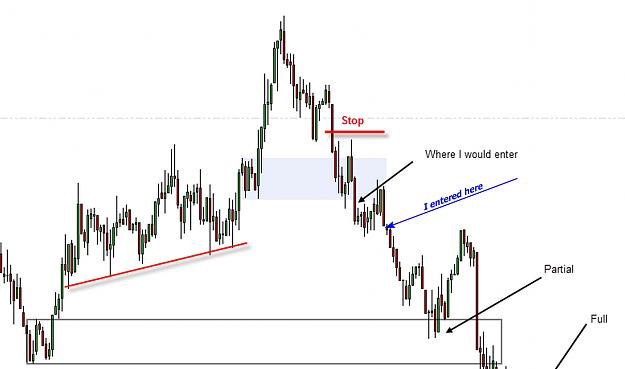
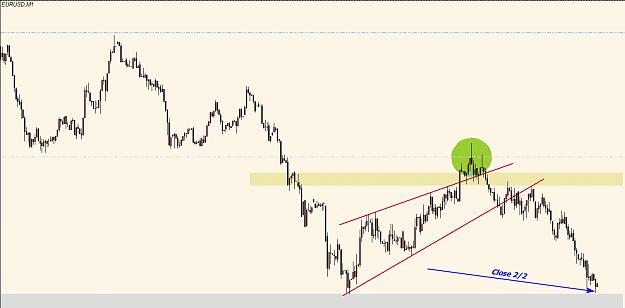
The 2nd chart is the key, 15sec chart - 2 DP's within the zone the edge and the source - look at the price action at them both - price tests them with small rejections which are quickly retrace - tells us all we need to know about the buying strength versus selling strength there.
I entered after the first DP PA appeared but it would have been 'safer' to wait until the 2nd one had occurred.
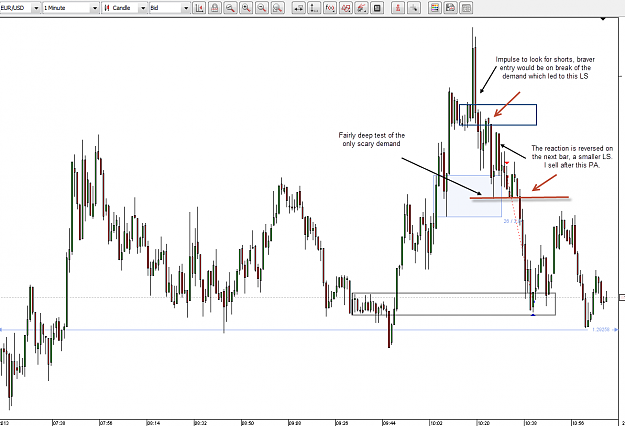
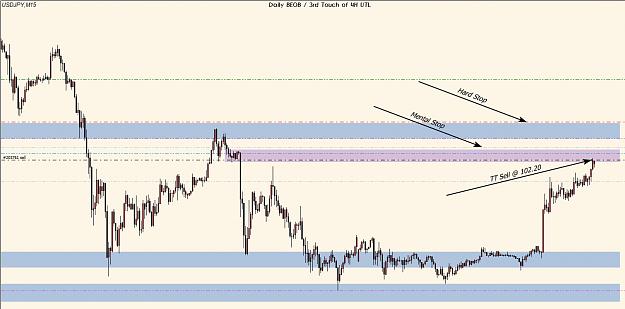
Anticipating a breakout above supply.
It may look like I'm going long straight into supply here but I'm not as the PA told me that the supply was likely consumed.
The 2nd chart is the key, 15sec chart - 2 DP's within the zone the edge and the source - look at the price action at them both - price tests them with small rejections which are quickly retrace - tells us all we need to know about the buying strength versus selling strength there.
I entered after the first DP PA appeared but it would have been 'safer' to wait until the 2nd one had occurred.
Attached Image(s) (click to enlarge)