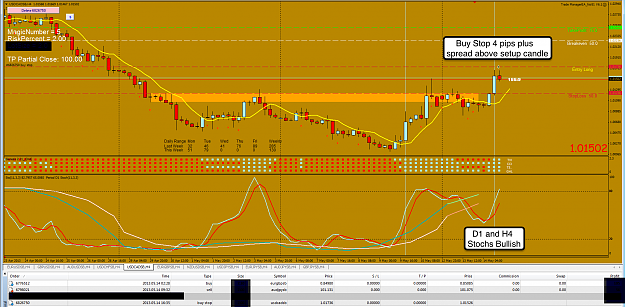
Attached Image (click to enlarge)
I am still working through the thread and catching. One thing I have done to blend together the use of HA and also the desire to see the candle close is to set the options on the chart to have a line graph, coloured to your choice (white for me) and then set the chart to foreground option
Voila, you get the HA but can see where the candle close prices are if you desire them. It works well for me as I can see the change in PA strength between candles just by the gradients between candles as they ebb and flow
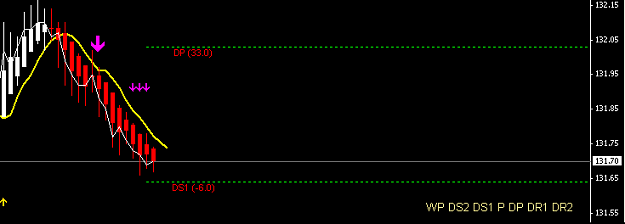
Attached Image (click to enlarge)