• Home
  • Forums
  • Trades
  • News
  • Calendar
  • Market
  • Brokers
  • Login
  • Join
  • User/Email: Password:
  • 12:07pm
Menu
  • Forums
  • Trades
  • News
  • Calendar
  • Market
  • Brokers
  • Login
  • Join
  • 12:07pm
Sister Sites
  • Metals Mine
  • Energy EXCH
  • Crypto Craft

Options

Bookmark Thread

First Page First Unread Last Page Last Post

Print Thread

Similar Threads

Are you a trend trader or a counter-trend trader? 29 replies

Ichi Trend & RSI Trend Catch 4 replies

trend up trend down 1 reply

Automatic Trend line, trend channel, support, resistance detection 3 replies

"Trend" , how do you actually trace the current trend ? 23 replies

  • Trading Systems
  • /
  • Reply to Thread
  • Subscribe
  • 24
Attachments: The Forex Trend
Exit Attachments
Tags: The Forex Trend
Cancel

The Forex Trend

  • Last Post
  •  
  • 1 Page 23 4
  • 1 Page 23 4
  •  
  • Post #21
  • Quote
  • Apr 22, 2013 9:17am Apr 22, 2013 9:17am
  •  Sarythsaya
  • | Joined Jul 2010 | Status: Building Edge SandwEdges | 280 Posts
Great system by the looks Spudfyre. Your work is always of the highest quality. I will play around with interest.
Enter Signature
 
 
  • Post #22
  • Quote
  • Apr 24, 2013 7:40am Apr 24, 2013 7:40am
  •  fcaillou
  • | Joined Jul 2008 | Status: Member | 31 Posts
My trade for today. Short EU 15min.

It seems a very clear one.

http://img854.imageshack.us/img854/1...1304241335.png

Uploaded with ImageShack.us
 
 
  • Post #23
  • Quote
  • Apr 24, 2013 11:49pm Apr 24, 2013 11:49pm
  •  Spudfyre
  • Joined Jan 2007 | Status: MTF Stochastics and Volume/Price | 1,133 Posts
The stochastics will give you plenty of info on how strong a trend might be. When you see the blue and red lines criss-cross...like a fish net...this is an extreme break down in market trend and you will typically see uneventful price ranging. You will easily begin to see how trend strength and range markets look as you spend time with this. I primarily trade EUR/USD, but I've used this for "decades" and developed it primarily from MTF Stochastics....it was an effort to save all the screen flipping involved in MTF (Multiple Time Frames). Back in the day before flat panels, it was a fire hazard to have 6 monitors hooked up...not too mention moving them was a chore!


Quoting Arctic4x
Disliked
{quote}Hi Spudfyre. Nice system and interesting combination of indicators. Lately i try to turn away from indicators but for some reason this system catch my eye. You say it works on any time frame but have you tested it on many different pairs and other instruments than forex? And even more interesting, how does it work in different market conditions? Of course i understand it is designed to work in trends but i guess what i am asking for is, does it keep you out of sideways and ranging market and other difficult conditions? I will test it for...
Ignored
 
 
  • Post #24
  • Quote
  • Apr 25, 2013 2:48am Apr 25, 2013 2:48am
  •  itsallover
  • Joined Jan 2011 | Status: ,,,,, ....,,,,,, | 6,008 Posts
Great job Spudfyre. Just finished reading the other thread about the ropes and I'm trying to combine the two concepts. I find the StdDev and Momentum Indies a little mangly...... but very interesting
.... laughing all the way to the bank
 
 
  • Post #25
  • Quote
  • Apr 25, 2013 9:06pm Apr 25, 2013 9:06pm
  •  Spudfyre
  • Joined Jan 2007 | Status: MTF Stochastics and Volume/Price | 1,133 Posts
Below is an example of a Stochastic Indicator "fishnet". When the blue and green lines make a criss-cross pattern like this you can almost always count on a ranging market.

What's happening? Well it is a lot like the market has it's wires crossed. In this example, the blue lines which represent our short term Stochastic signals are indicating that the market trend will start to rise, and true to form price actually does rise a little. However, the blue lines are crossing up and across our red long term Stochastic signal lines. These red lines are going down. Now the fish net alone is a good indication the trend is dead.

We have more info here. The yellow BS line (Base Stochastic) is in the oversold area under the 23.6 level, with this fishnet occurring this means this down trend and oversold market is extremely weak...weak to the point of no existence.

If you look at all the indicators, then look after the fishnet area. See where the single Heiken Ashi turns red and then the price shoots upwards and the HA turns blue? Now look at our other indicators at this point, see how they all consolidate and narrow together. Also see the BS Stochastic go into oversold across the 76.4 line. All of that is a great point to make an investment into the price going up. You'd want to make that investment at about the 3rd blue HA candle in from that lone red HA candle. The signals aren't as clear, and the guarantee not as great, but it is a good position for a sound buy into the market.

The exit from the long is extremely clear at the end of this chart with just typical cross overs.
Attached Image (click to enlarge)
Click to Enlarge

Name: pic7.gif
Size: 38 KB
 
 
  • Post #26
  • Quote
  • Apr 25, 2013 9:14pm Apr 25, 2013 9:14pm
  •  Spudfyre
  • Joined Jan 2007 | Status: MTF Stochastics and Volume/Price | 1,133 Posts
I agree the mangly moves can scatter your brain a bit, but they do tell a lot. Sometimes you have to toss out one, the STD Dev or the Momentum because the befuddle you, but one of them along with HA and Stochastics should make sense.

That mangly is why people ignore these indicators, because it doesn't look like a clear signal. Just remember momentum always shows the death of a trend. There is a chart above I posted (PIC 7), where we have 4 distinct price trend changes and the momentum identifies their death with blue lines crossing the yellow line. Is it extremely clear, no, definitely not by itself. Coincide the other indicators together and it should come into crystal clear focus.

Quoting itsallover
Disliked
Great job Spudfyre. Just finished reading the other thread about the ropes and I'm trying to combine the two concepts. I find the StdDev and Momentum Indies a little mangly...... but very interesting
Ignored
 
 
  • Post #27
  • Quote
  • Apr 26, 2013 1:18am Apr 26, 2013 1:18am
  •  Jse Alsi
  • | Joined Jan 2010 | Status: Member | 82 Posts
Spud if you roll the scroll button back and fourth you get different readings on the STD DEV and Momentum indies,none of the layered indicators have been set to the "ist indicator data" in the settings ,how do you sugest this problem is over come or am i missing something, Ive tried setting all to 1st indi data using the BS yellow as primary indicator but this just gave more confusion and doesnt correspond to your rules.Stochastic is fine ,been using this for years.
 
 
  • Post #28
  • Quote
  • Apr 26, 2013 2:33am Apr 26, 2013 2:33am
  •  itsallover
  • Joined Jan 2011 | Status: ,,,,, ....,,,,,, | 6,008 Posts
Quoting Spudfyre
Disliked
I agree the mangly moves can scatter your brain a bit, but they do tell a lot. Sometimes you have to toss out one, the STD Dev or the Momentum because the befuddle you, but one of them along with HA and Stochastics should make sense. That mangly is why people ignore these indicators, because it doesn't look like a clear signal. Just remember momentum always shows the death of a trend. There is a chart above I posted (PIC 7), where we have 4 distinct price trend changes and the momentum identifies their death with blue lines crossing the yellow line....
Ignored
I like it Spudfyre. I'm already seeing a good use for the rope effect to pinpoint perfect entries. Now I'll go through your posts again and again until I can recite them and see the pictures in my sleep. Then I'll get it lol.

Thanx again for a wonderful thread
.... laughing all the way to the bank
 
 
  • Post #29
  • Quote
  • Apr 26, 2013 8:11am Apr 26, 2013 8:11am
  •  Spudfyre
  • Joined Jan 2007 | Status: MTF Stochastics and Volume/Price | 1,133 Posts
Thanks for mentioning this. Depending on how you have your MT4 set up, you can get around this issue by adjusting and fixing the min/max on the scales. You will need to do that for each line on the indicator. To find a good setting just find the range that the indicators moved through for the period you are looking at and increase it a bit. If you get too big a range the lines will flatten too much in a small range.
Save each template when you change the range, this will allow you to flip ranges easily in the future.

The lines appear to move during a dynamic range transition, but they are just adjusting to scale - so they adjust left to right on the chart in sequence. You don't have to adjust scales on your chart if you are aware of it and get used to what is happening.


Quoting Jse Alsi
Disliked
Spud if you roll the scroll button back and fourth you get different readings on the STD DEV and Momentum indies,none of the layered indicators have been set to the "ist indicator data" in the settings ,how do you sugest this problem is over come or am i missing something, Ive tried setting all to 1st indi data using the BS yellow as primary indicator but this just gave more confusion and doesnt correspond to your rules.Stochastic is fine ,been using this for years.
Ignored
 
 
  • Post #30
  • Quote
  • Apr 26, 2013 9:32am Apr 26, 2013 9:32am
  •  Forexgogo
  • | Joined Feb 2010 | Status: Member | 1,032 Posts
Spudfyre

Good to see you start a new thread!! I'm a big fan of your MTF indy (I use only this indy and EMA200).

I strongly believe that you should create an EA with this method. Reasons are (1) it looks like fairly simple system and (2) I really don't like to keep watching indies all the time

Thank you very much!
 
 
  • Post #31
  • Quote
  • Apr 26, 2013 3:29pm Apr 26, 2013 3:29pm
  •  Spudfyre
  • Joined Jan 2007 | Status: MTF Stochastics and Volume/Price | 1,133 Posts
It might be difficult to EA, there is still a realm of trader interpretation involved. Certainly an EA could provide you certain signals, but I'm not sure how success would compare with doing it live with the mind. This is one of those things the more you use it the better you get, and maybe if an EA stuck to the more simple definite signals it might work, at least to help aid. However, I think you would miss so many things, like early entry opportunities and fish nets range markets, tight ropes and other visual cues.

This is after all, a visual trading system...if someone wants to take a shot with an EA, I'm glad to toss my two cents in with development, but think it would get hung up on the details, or take a mighty good programmer.


You nailed it on the head...visually it is a very simple system....like looking at Fractals, get into the math and numbers and it is an entirely different world.

Quoting Forexgogo
Disliked
Spudfyre Good to see you start a new thread!! I'm a big fan of your MTF indy (I use only this indy and EMA200). I strongly believe that you should create an EA with this method. Reasons are (1) it looks like fairly simple system and (2) I really don't like to keep watching indies all the time Thank you very much!
Ignored
 
 
  • Post #32
  • Quote
  • Apr 26, 2013 8:55pm Apr 26, 2013 8:55pm
  •  Spudfyre
  • Joined Jan 2007 | Status: MTF Stochastics and Volume/Price | 1,133 Posts
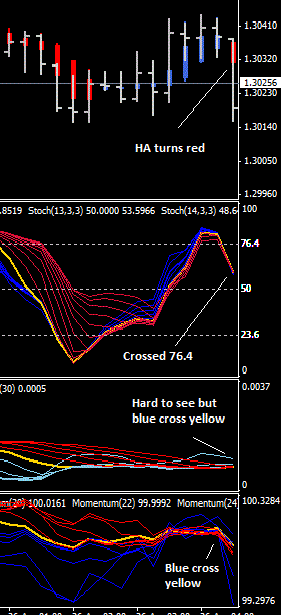
The next few charts walk through a live trade, and watch carefully because you will probably not believe how something so befuddled looking as the Momentum indicator along with these other indicators can tell us so much. There's nothing special here, just a typical trend move in price.

We are trading short here and following a short trend.

Here's our entry, simple enough:

Heiken Ashi turns red.
Stochastics BS (yellow) Line moves down and across the 76.4 line. Added bonus, blue,red and BS Line all tight together.
Hard to see our Standard Deviation, but our blue lines are crossing yellow line.
Momentum crossed yellow - signalling the end of the long trend (blue HA)

I cannot emphasize this enough, that Momentum signals the end of a trend.
You may think that signalling the end of one trend means the start of another...WRONG!

If you look closely, on the Momentum indicator the blue crosses the yellow starting at the last HA blue candle - end of the blue long trend.
Attached Image
 
 
  • Post #33
  • Quote
  • Apr 26, 2013 9:02pm Apr 26, 2013 9:02pm
  •  Spudfyre
  • Joined Jan 2007 | Status: MTF Stochastics and Volume/Price | 1,133 Posts
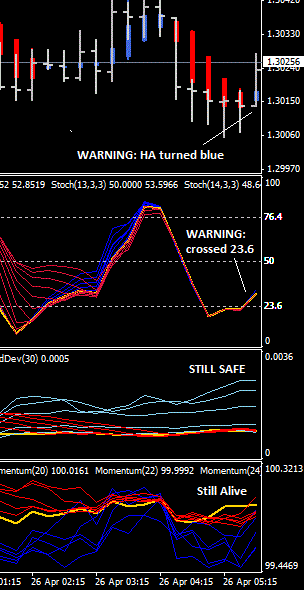
Jump forward a little. We now have the Stochastics crossing 23.6, this is a safe exit point...but an early exit from this trend.

See what our Standard Deviation is doing...just purring along above the yellow line. I'm more worried here about the top 2 blue lines, the other blue and red lines are all wrapped around the yellow line, so we are purring along in this trend.

Likewise our Momentum is still exiting out of the end of the previous long trend and has no indication that this short trend is ending.

For those wondering....when the stochastics (which is still a nice tightly bound group of blue, red and yellow lines) crosses down below the 23.6 level line, it is in an oversold market. Oversold markets are extremely dangerous places (like overbought markets) to be in as price can bite back and the market reverse on you. Which is why when the stochastic yellow BS Line crosses 23.6 like this in a short trend it is a nice safe exit. However, we have the "power" of Std Dev and Momentum on our side...and that's a good bet to stay short and ride the oversold market.
Attached Image
 
 
  • Post #34
  • Quote
  • Apr 26, 2013 9:16pm Apr 26, 2013 9:16pm
  •  Spudfyre
  • Joined Jan 2007 | Status: MTF Stochastics and Volume/Price | 1,133 Posts
Here we go....critical moment of decision and the power of Momentum (along with the other indicators here):

Heiken Ashi turned blue and our Stochastics yellow BS Line crossed up from 23.6....this would normally in the Stochastics world have you looking for a price rising.

Not so with our Std Dev....blue lines still purring along. No cross of the yellow line.

Now Momentum...remember when the blue lines cross the yellow line it indicates the end of a trend...no cross, no end to our short red HA trend is being signaled. See it? Got it?

If our Std Dev blue lines were crossing the yellow line, it is a good idea to bail on Momentum and just exit the trade. 3 indicators against you, I'd get out and play safe. But here, we have Momentum and STD Dev working for us and you could exit, but it is a safe bet to ride this out.
Attached Image
 
 
  • Post #35
  • Quote
  • Apr 26, 2013 9:27pm Apr 26, 2013 9:27pm
  •  Spudfyre
  • Joined Jan 2007 | Status: MTF Stochastics and Volume/Price | 1,133 Posts
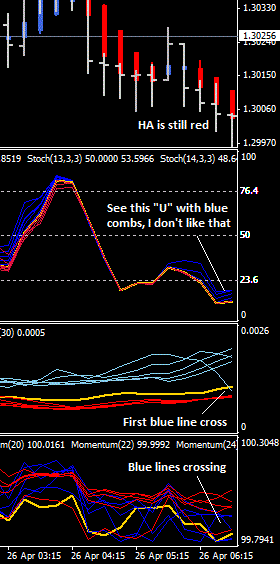
So as we move along the HA goes back to red, and the Stochastics goes back down across the 23.6 level.

There's a blip in the STD Dev blue line, so things might start to change. That blip may also be caused by the bump in our short trend when the HA turned blue.

Momentum has early indications of blue lines crossing the yellow line. This could be just signalling the end of the long trend blip we just saw. It also could be signalling the end of our short trend.

For now with HA red and Stochastics oversold, I'd go some more with this short trend. Nothing wrong with an exit here, we are playing into the Stochastic oversold market again and the dangers are lurking.

I should mention, you can see our blue stochastics lines starting to comb out, if we see any hint of a "U" shape, in the Stochastics from here on, we exit.
Attached Image
 
 
  • Post #36
  • Quote
  • Apr 26, 2013 9:41pm Apr 26, 2013 9:41pm
  •  Spudfyre
  • Joined Jan 2007 | Status: MTF Stochastics and Volume/Price | 1,133 Posts
Now, we really have no option but to exit this short trend. Risk takers could try one more candle to see what happens, but here the odds are starting to move against us.

My tell tale sign along with the STD DEV and Momentum is that "U" shape forming on the Stochastic....it's not quite a "U" yet, but given the STD DEV first blue line crossed yellow and Momentum is clearly indicating the "END" of a trend, things look risky to stay short.

You could argue that Momentum is just closing the trend life of that long trend blip we went through, and if this was the only indicator making a movement, I'd stay.
Attached Image
 
 
  • Post #37
  • Quote
  • Apr 26, 2013 9:51pm Apr 26, 2013 9:51pm
  •  Spudfyre
  • Joined Jan 2007 | Status: MTF Stochastics and Volume/Price | 1,133 Posts
So as they short trend comes to an end, we can see how this system gave us plenty of notice to exit. Sure, you could have stayed in and rode it out a bit longer, but not many pips more to be gained from when we first saw the warning signs.

You can see by the time we reach the new blue HA, everything is into a long trend signal. And yes, you had plenty of warning the long trend was coming before the blue HA came along.
Attached Image
 
 
  • Post #38
  • Quote
  • Apr 27, 2013 4:13am Apr 27, 2013 4:13am
  •  Arctic4x
  • | Joined Sep 2006 | Status: Member | 213 Posts
Thanks Spudfyre.

Very nice walk through. Really helps understanding your thinking and decision making process.

Arctic4x
 
 
  • Post #39
  • Quote
  • Apr 27, 2013 2:34pm Apr 27, 2013 2:34pm
  •  Caldeira
  • | Joined Jun 2011 | Status: Member | 9 Posts
Thank you, master the market!

Sensational operating strategy!

I'm Brazilian!

When I get rich I want to meet you!
 
 
  • Post #40
  • Quote
  • Apr 28, 2013 12:45am Apr 28, 2013 12:45am
  •  Friday1888
  • | Joined Apr 2013 | Status: Member | 20 Posts
Hi Spud
Glad to see u r back
waiting for ur return since 2010
please stay with us until we fully understand the system
thanks a lot
 
 
  • Trading Systems
  • /
  • The Forex Trend
  • Reply to Thread
    • 1 Page 23 4
    • 1 Page 23 4
0 traders viewing now
  • More
Top of Page
  • Facebook
  • Twitter
About FF
  • Mission
  • Products
  • User Guide
  • Media Kit
  • Blog
  • Contact
FF Products
  • Forums
  • Trades
  • Calendar
  • News
  • Market
  • Brokers
  • Trade Explorer
FF Website
  • Homepage
  • Search
  • Members
  • Report a Bug
Follow FF
  • Facebook
  • Twitter

FF Sister Sites:

  • Metals Mine
  • Energy EXCH
  • Crypto Craft

Forex Factory® is a brand of Fair Economy, Inc.

Terms of Service / ©2023