• Home
  • Forums
  • Trades
  • News
  • Calendar
  • Market
  • Brokers
  • Login
  • Join
  • User/Email: Password:
  • 7:30pm
Menu
  • Forums
  • Trades
  • News
  • Calendar
  • Market
  • Brokers
  • Login
  • Join
  • 7:30pm
Sister Sites
  • Metals Mine
  • Energy EXCH
  • Crypto Craft

Options

Bookmark Thread

First Page First Unread Last Page Last Post

Print Thread

Similar Threads

Are you a trend trader or a counter-trend trader? 29 replies

Ichi Trend & RSI Trend Catch 4 replies

trend up trend down 1 reply

Automatic Trend line, trend channel, support, resistance detection 3 replies

"Trend" , how do you actually trace the current trend ? 23 replies

  • Trading Systems
  • /
  • Reply to Thread
  • Subscribe
  • 24
Attachments: The Forex Trend
Exit Attachments
Tags: The Forex Trend
Cancel

The Forex Trend

  • Last Post
  •  
  • Page 1 23 4
  • Page 1 23 4
  •  
  • Post #1
  • Quote
  • First Post: Edited 9:17pm Apr 18, 2013 8:40pm | Edited 9:17pm
  •  Spudfyre
  • Joined Jan 2007 | Status: MTF Stochastics and Volume/Price | 1,133 Posts
This is how to trade a Forex Trend. It's a system, and success is based on your discipline to accept when to exit a trend. I'll post an MT4 template,as it is somewhat tedious to set up. You would do yourself a great favour to read my MTF Stochastics and Escalator to Pip threads, if you want in depth theory and be slightly ahead of the game.

The system works because we are following 4 indicators that are designed to show us the trend in the short and long term -- together. The indicators are:

Heiken Ashi - to make the trend visible on the price chart
Stochastics - so we know where we are in the trend
Standard Deviation - so we know when the trend is changing (volatility in price)
Momentum - so we know when the current trend just passed is dead -- Momentum tells you what is happening to the historical trend, never forecasting the future or trend just developing -- extremely important to remember!

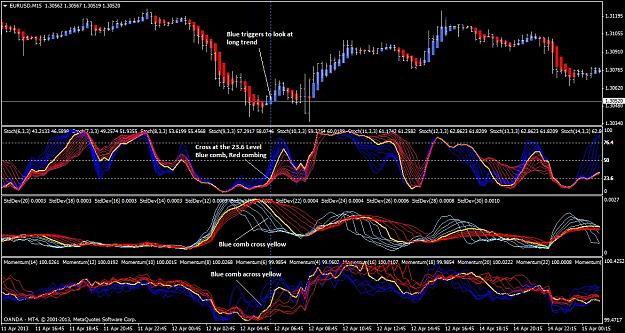
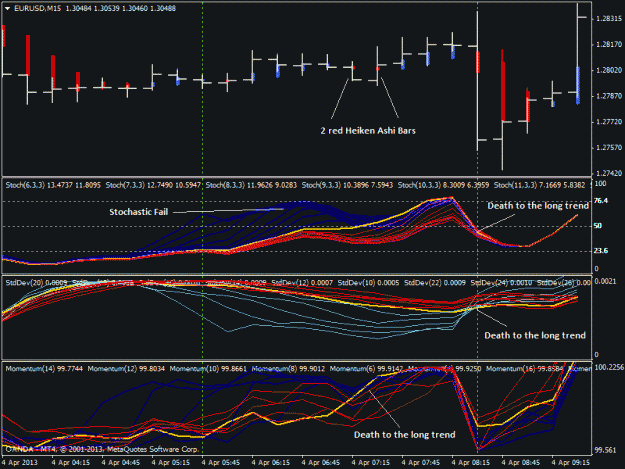
Here's how a typical long thread entry is triggered (see chart below):

I like to work from the top of the chart down for safe conservative entries. For early signals you work from the bottom up of the chart.
Starting at the top:

A note: the blue lines represent the short term and the red lines the long term on each indicator. The thick yellow lines are the base setting of the indicator, called the base lines.

Heiken Ashi - turns blue which is a trigger that a long trend could be forming.

Stochastics - the yellow Base Stochastic line (BS Line) crosses up across the 23.6 level. Key is that the blue lines have also crossed the 23.6 level and that they are nicely "combed" in sequence. Notice the red lines are also starting to comb. Also make note that just before the trend starts how nice and tight the blue and red lines were to the BS Line.

Standard Deviation - this is an early or confirmation trigger. It will generally start a signal prior to the thread starting. Key is that the blue lines cross the yellow line (up or down does not matter). We'd like to see a nice comb like in this chart, but the blue lines crossing is the signal for a trend change. Standard Deviation measures volatility - which used in this way indicates a change in trend.

Momentum - early indications of the previous trend dying. Momentum only refers to the historic, previous trend. Never forget this! When looking at momentum we are thinking about the past/previous. Momentum indicator works the same for signal as the Standard Deviation, when the blue lines cross the yellow line it is a great indication that the current trend is finished.

Yes, this is extremely simple! And it works extremely well.
Attached Image (click to enlarge)
Click to Enlarge

Name: pic1.jpg
Size: 299 KB
  • Post #2
  • Quote
  • Apr 18, 2013 8:45pm Apr 18, 2013 8:45pm
  •  Spudfyre
  • Joined Jan 2007 | Status: MTF Stochastics and Volume/Price | 1,133 Posts
This is the MT4 template:
Attached File(s)
File Type: tpl forex trend.tpl   11 KB | 2,221 downloads
 
1
  • Post #3
  • Quote
  • Apr 18, 2013 9:16pm Apr 18, 2013 9:16pm
  •  Spudfyre
  • Joined Jan 2007 | Status: MTF Stochastics and Volume/Price | 1,133 Posts
Theory Section - Why This Works

Forex trading, successful Forex trading, is all about being able to see the market and what it is doing so that you know when to enter and exit a trade. Whether, I explain this using stochastics or as clean as using price levels and volume, the message and result is the same....finding a way that works for you to see the market.

This system is nice and colourful. The blue and red lines you see represent multiple times. The blue lines being the short term and the red lines being the long term. Believe it or not, the use of the blue and red lines are a science in themselves, but we'll forgo that detail for now and focus on the easy stuff first.

I briefly explained the indicators at the beginning of this thread, and the yellow base lines. What really makes this system work is the entire interaction of all 4 indicators. Each single indicator can work alone with many false signals, but together and used with multiple time lines changes the landscape and puts Forex Trending into our advantage.

Why this system works and it really is no secret, is that it exposes a trend's life visually well. Now the trick is learning when to pull out. Knowing what we see, when to enter, when to exit and accepting that this is a good time to exit, sometimes swallowing a loss is the rule. We can't always run every trend to 500 pip gains on the M15. OK? One more item, a trend does not always last a long time, some trends can be very short -- when I mean short I refer to number of candles.

This system works on any time frame. However, the longer the time frame you use, the more money you will have a risk. I recommend starting with the M15 and working up. M15 is a good time frame for the $1/pip trader with lots of action and opportunity for good gains with low risk for losses.

The Stochastics indicator is our bread and butter. Generally we are looking for one of four things with the BS Line:
1. The BS Line crosses up over the 23.6 level line (long)
2. The BS Line crosses down under the 76.4 level line (short)
3. The BS Line is in oversold territory (under the 23.6 level line)
4. The BS Line is in the overbought territory (over the 76.4 level line)
When the Stochastic blue and red lines look like a net (crisscross each other) this means the market is very unstable and we want nothing to do with it. When the stochastic blue and red lines are extremely tight and narrow to the yellow BS Line we are at the cusp of a trend. Ideally, we want the blue and red lines to form a straight, reasonably narrow comb effect of sequential lines, generally starting very tightly to the yellow BS Line and then gradually expanding and ideally making a nice little "U" turn across a level line. Don't worry we'll see all this shortly.
 
 
  • Post #4
  • Quote
  • Apr 18, 2013 9:34pm Apr 18, 2013 9:34pm
  •  Spudfyre
  • Joined Jan 2007 | Status: MTF Stochastics and Volume/Price | 1,133 Posts
So here's another chart:

Our Heiken Ashi turned red.
Jump down to Momentum at the bottom - see the blue lines crossing the yellow signal line, that's the death of the previous long trend. Momentum is always signalling the death of a previous trend.
Move up to Standard Deviation and blue lines are crossing the yellow line, yes, only 3 lines have crossed but given all of the other indicators, this is fine as a signal.

Stochastics - see how the red and blue lines where all tight with the yellow line in the oversold position just prior to the trend change? See how the blue lines make a slight curve and then drop sequentially across and down the 76.4 level with the yellow BS Line following....ok that is picture perfect with the red line still tight above.

To follow this short trend, watch the red Heiken Ashi, watch the stochastic blue lines comb and flow down to the 23.6 level (classic Escalator to Pips move), and sorry I chopped the chart off at the bottom but you would see Momentum blue lines turning and crossing the yellow signal line when the short trend ended.

Now one thing to note is that our Standard Deviation is lagging a bit behind the other indicators and the blue lines will not cross the yellow indicator line when this short trend ends. The simple explanation, is that we see the upturn, 3/4 indicators tell us when to get out, so we are out. The Std Deviation blue lines do turn up and collide with the yellow line. Of course there is more to that move, but for now you can still use that as a reliable conservative indication of trend change.
Attached Image
 
 
  • Post #5
  • Quote
  • Apr 18, 2013 9:55pm Apr 18, 2013 9:55pm
  •  Spudfyre
  • Joined Jan 2007 | Status: MTF Stochastics and Volume/Price | 1,133 Posts
Last post for the day, here's a chart where we can see why the trend wouldn't develop:

Heiken Ashi turns blue.
Stochastics cross the 23.6 level, blue is combed, red was tight and just spreading. BUT, notice the stochastic jumble of red and blue lines just prior. That's a mess.
Standard Deviation, absolutely no signal.
Momentum, see how the blue lines have crossed the yellow line compared to my previous examples. And notice the jumble mess of blue and red lines. Now Momentum can be a jumble mess most of the time...but really things are not good here.
Everything here is telling us this long trend just isn't where we want to enter.
Compare this to the above charts.
Attached Image
 
 
  • Post #6
  • Quote
  • Edited 6:59am Apr 19, 2013 4:55am | Edited 6:59am
  •  fcaillou
  • | Joined Jul 2008 | Status: Member | 31 Posts
Very, very, interesting system and bravo for your clear explanation.

I suscribe and will follow your thread with great interest.
 
 
  • Post #7
  • Quote
  • Apr 19, 2013 10:56am Apr 19, 2013 10:56am
  •  tradermark1
  • | Joined Feb 2013 | Status: Member | 9 Posts
very nice system spud, i will give it a try.
 
 
  • Post #8
  • Quote
  • Edited 1:11pm Apr 19, 2013 12:08pm | Edited 1:11pm
  •  4xplosion
  • | Joined Oct 2007 | Status: Member | 447 Posts
Like the simplicity of it.........keep it coming!
 
 
  • Post #9
  • Quote
  • Apr 19, 2013 7:54pm Apr 19, 2013 7:54pm
  •  whatfx
  • | Joined Jun 2010 | Status: The Villain | 2,565 Posts
Quoting Spudfyre
Disliked
This is the MT4 template: {file}
Ignored
can you attach the indicators seperately ?
 
 
  • Post #10
  • Quote
  • Apr 19, 2013 10:14pm Apr 19, 2013 10:14pm
  •  Spudfyre
  • Joined Jan 2007 | Status: MTF Stochastics and Volume/Price | 1,133 Posts
This is the Heiken Ashi Smoothed Indicator
Attached File(s)
File Type: mq4 Heiken_Ashi_Smoothed.mq4   4 KB | 978 downloads
 
 
  • Post #11
  • Quote
  • Apr 19, 2013 10:32pm Apr 19, 2013 10:32pm
  •  Spudfyre
  • Joined Jan 2007 | Status: MTF Stochastics and Volume/Price | 1,133 Posts
This is a chart of a little more complex trend, but you will see how the rules hold true and keep you out of trouble.

What we'll see here is the long trend form, face a short but steep short and then back to a long trend again. We can follow this quite easily:

Heiken Ashi is blue. Notice how we wait for the other signals to catch up for this long trend.

Stochastics yellow BS Line crosses 23.6 level, blue comb, red spreading. Also notice how we came from blue and red being tight together against our yellow BS Line just previous.

Our Std Dev blue isn't a perfect cross of the yellow line. This might persuade you to stay clear of this entry. I'd weigh in more with the stochastics indicator and use the fact we have 3/4 indicators right. As we can see as this trend develops the Std Dev is telling us something, and this long trend wasn't quite ready yet.

Momentum we have the blue lines crossing the yellow.

So, taking all things into account our indicators showed us this would be a weak long trend because the Std Dev indicator blue lines did not cross the yellow. Being our stubborn selves we opt for 3/4 being right and the Std Dev blue lines sort of crossing the yellow line and we enter the long trade. See what it gets you! It isn't that we can't enter...it just isn't perfect and we better be on our game to catch the short that follows.
Attached Image (click to enlarge)
Click to Enlarge

Name: pic4.gif
Size: 39 KB
 
 
  • Post #12
  • Quote
  • Apr 19, 2013 10:47pm Apr 19, 2013 10:47pm
  •  Spudfyre
  • Joined Jan 2007 | Status: MTF Stochastics and Volume/Price | 1,133 Posts
So lets take a closer look after entry and what is happening in this weak long trend and what the indicators tell us.

Between the green vertical dashed lines a lot happens in our long trend. First, our stochastic blue line comb is breaking apart. Notice how it is failing to cross the 76.4 line. This is a key signal that the trend could fail. It is supported when the Heiken Ashi candles turn red and at the same point in time the blue lines collapse to the yellow BS line.

You can also see the momentum die in the long trend when the blue lines cross the yellow line, Heiken Ashi is red, and our stochastics have failed.

That's the early warning.

Get to the vertical green line on the right and we have short trend entry signals. Our long trend is dead.
Also notice how our momentum and stochastics do not really support a short trend entry here.
Pay attention, be picky and the good trades will come.
Attached Image (click to enlarge)
Click to Enlarge

Name: pic5.gif
Size: 36 KB
 
 
  • Post #13
  • Quote
  • Apr 19, 2013 11:06pm Apr 19, 2013 11:06pm
  •  Spudfyre
  • Joined Jan 2007 | Status: MTF Stochastics and Volume/Price | 1,133 Posts
You can get some great early signals for a trend change with this system.

Heiken Ashi isn't pointing to a long trend coming, but everything else is.

Classic stochastics blue is tight to yellow BS Line and you may npt see it in this pixture, but the blue lines are crossing the yellow BS LIne and the yellow BS Line is crossing 23.6 level.

Std Deviation blue lines cross the yellow line.

Momentum blue lines, hard to see but they do cross the yellow line.

This is definitely a higher risk entry but the reward can be phenom. These kind of entries will pay off more than they fail.
Attached Image
 
 
  • Post #14
  • Quote
  • Apr 19, 2013 11:35pm Apr 19, 2013 11:35pm
  •  Spudfyre
  • Joined Jan 2007 | Status: MTF Stochastics and Volume/Price | 1,133 Posts
How perfect our signals are can be considered how risky our entry is. The more imperfect and less indicators that line up, the higher the risk the trend will develop. One thing you can do to make this even more accurate is to use multiple time frames and the theory behind MTF (multiple time frame) Stochastics - which I wrote a thread on.

MTF is a big subject and with this system it is best to have 3 or 4 screens attached to your computer. For now, I'm not going to complicate this with MTF, but what MTF will give us is the ability to follow a trend much longer and much better. It isn't hard to figure out MTF on your own, so long as you read what I wrote in MTF Stochastics and really using the stochastics indicator along with the others here.

I thought I'd mention that for people who want to jump ahead.

Having said all that, we don't need MTF to be successful. We'll let the fun begin and start learning what trading looks like with stops, exits and of course entries using the system as I have so far presented it. Not to worry, if you read anything I wrote before in Forex Factory....I promise not to talk about 20 pips a day! This is trending and with trending the life of the trend determines our pips.
 
 
  • Post #15
  • Quote
  • Apr 21, 2013 10:16am Apr 21, 2013 10:16am
  •  Eureka
  • | Joined Aug 2006 | Status: Member | 383 Posts
Spudfyre,

Thanks for presenting this system. I'm going to try it this week.

Caroline
 
 
  • Post #16
  • Quote
  • Apr 21, 2013 4:15pm Apr 21, 2013 4:15pm
  •  Piotr1
  • | Joined Dec 2008 | Status: Member | 215 Posts


Hi, Spudfyre. I am curious, are you the author of the MTF Stochastic.mq4 ?
 
 
  • Post #17
  • Quote
  • Apr 21, 2013 4:32pm Apr 21, 2013 4:32pm
  •  Spudfyre
  • Joined Jan 2007 | Status: MTF Stochastics and Volume/Price | 1,133 Posts
Sweet!

Quoting Eureka
Disliked
Spudfyre, Thanks for presenting this system. I'm going to try it this week. Caroline
Ignored
 
 
  • Post #18
  • Quote
  • Apr 21, 2013 4:34pm Apr 21, 2013 4:34pm
  •  Spudfyre
  • Joined Jan 2007 | Status: MTF Stochastics and Volume/Price | 1,133 Posts
Just the thread. My MT4 indicator writing skills are zero. Some very good people put together a bunch of indicators for MTF Stochastics.

Quoting Piotr1
Disliked
Hi, Spudfyre. I am curious, are you the author of the MTF Stochastic.mq4 ?
Ignored
 
 
  • Post #19
  • Quote
  • Apr 22, 2013 4:07am Apr 22, 2013 4:07am
  •  fcaillou
  • | Joined Jul 2008 | Status: Member | 31 Posts
First trade of the week on Eur/Usd M5. Just after london openning.

Great system Spudfyre.

http://img850.imageshack.us/img850/116/201304221001.png

Uploaded with ImageShack.us
 
 
  • Post #20
  • Quote
  • Apr 22, 2013 6:15am Apr 22, 2013 6:15am
  •  Arctic4x
  • | Joined Sep 2006 | Status: Member | 213 Posts
Quoting Spudfyre
Disliked
This system works on any time frame. However, the longer the time frame you use, the more money you will have a risk. I recommend starting with the M15 and working up.
Ignored
Hi Spudfyre.

Nice system and interesting combination of indicators. Lately i try to turn away from indicators but for some reason this system catch my eye.

You say it works on any time frame but have you tested it on many different pairs and other instruments than forex? And even more interesting, how does it work in different market conditions?
Of course i understand it is designed to work in trends but i guess what i am asking for is, does it keep you out of sideways and ranging market and other difficult conditions?

I will test it for myself so i am not asking because i am to lazy to have a look myself but often the designer of a system have a better view on this type of things as long as it is a experienced trader, and i know you are.

Thanks.
Arctic4x
 
 
  • Trading Systems
  • /
  • The Forex Trend
  • Reply to Thread
    • Page 1 23 4
    • Page 1 23 4
0 traders viewing now
  • More
Top of Page
  • Facebook
  • Twitter
About FF
  • Mission
  • Products
  • User Guide
  • Media Kit
  • Blog
  • Contact
FF Products
  • Forums
  • Trades
  • Calendar
  • News
  • Market
  • Brokers
  • Trade Explorer
FF Website
  • Homepage
  • Search
  • Members
  • Report a Bug
Follow FF
  • Facebook
  • Twitter

FF Sister Sites:

  • Metals Mine
  • Energy EXCH
  • Crypto Craft

Forex Factory® is a brand of Fair Economy, Inc.

Terms of Service / ©2023