DislikedHey Joao (portuguese compatriot I'm guessing?), I'm not very familiar with using COT report, can you explain how do you use the positions of commercials and large speculators to your analysis? Are the commercials the corporations who use futures to buy/sell commodities and hedgers? And does the smart money make a up a big part of the large speculators or not?
Ignored
About COT, I see the commercials as the "smart money". They are the corporations, big farms, etc., that uses the futures markets to hedge their business. Therefore, they have an army of analysts that study the market, forecasts it, to the best interest of the corporations that they work for.
Because they are hedges, their positions are always contrary to the price trend. If euro is going up, they are accumulation short positions and vice-versa.
Anyways, what we have to look for in a COT charts is how much their positions is extended in one direction or the other and, also, how much it is the difference from the speculators.
You can have a look on the charts to see what happens when the commercial and spec positions are too near or too far from each other. These are signs that a turn is coming to the market.
And that is basically how we have to look at COT charts, the extremes in divergences or convergences in the commercials and spec positions.
Larry Williams has a very good book on the subject titled "Trade stocks and commodities with the insiders. Secrets of the COT report". I recommend it.
But he has a more long term approach so he actually takes signals and entries/exits using the COT chart signals, and it means to take 3, 5 trades year.... :-)
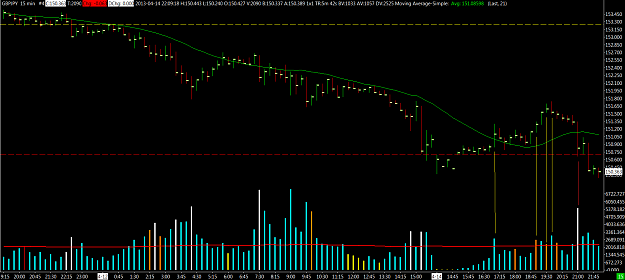
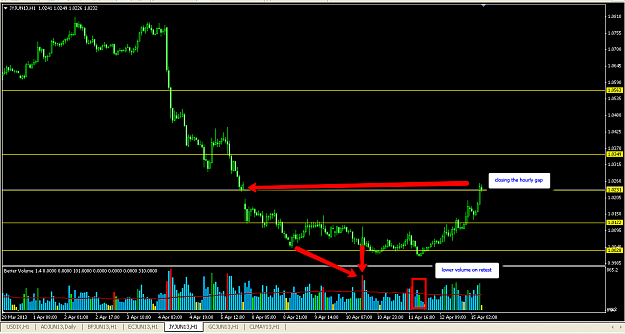
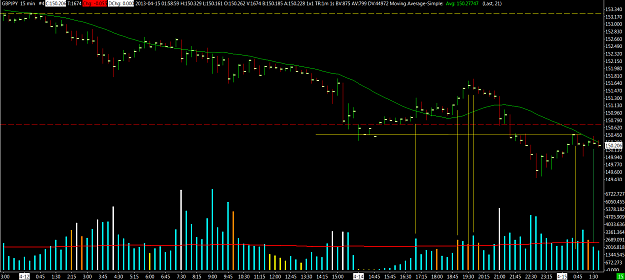
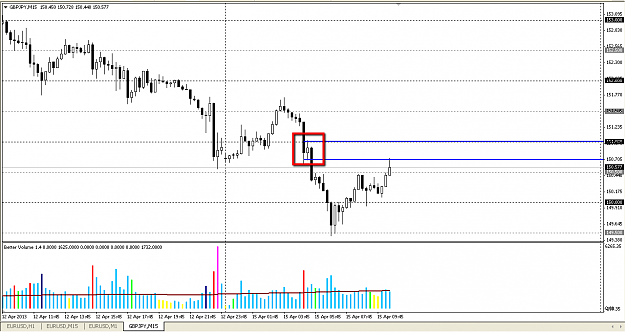
But for day trading, as I said, can be interesting because we can put more weight on some trades than others. See how cable is refusing to fall and its 1hr chart is keeping a bullish trend.
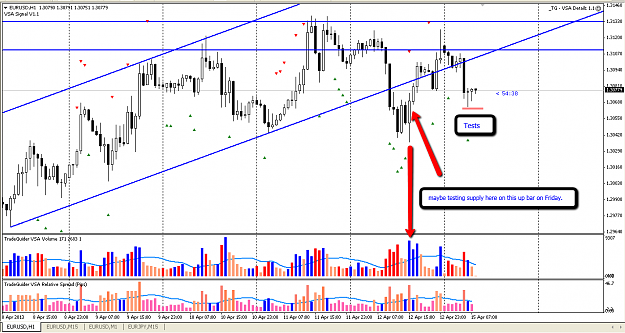
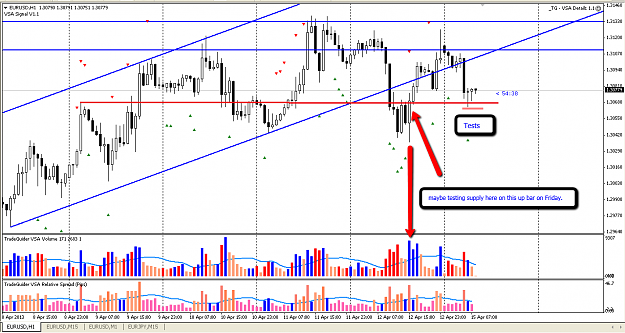
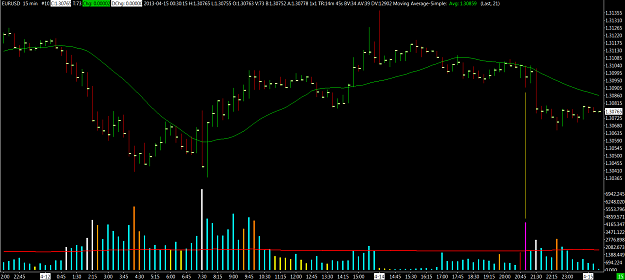
On the other side, even COT is showing euro is bearish, it is also in a 1hr up trend... :-)