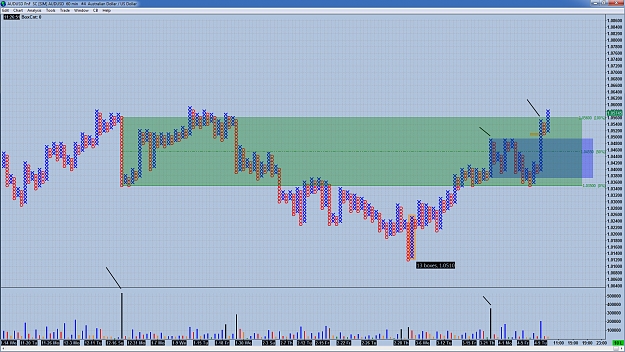
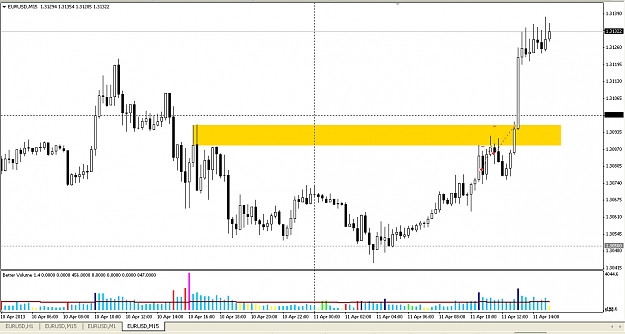
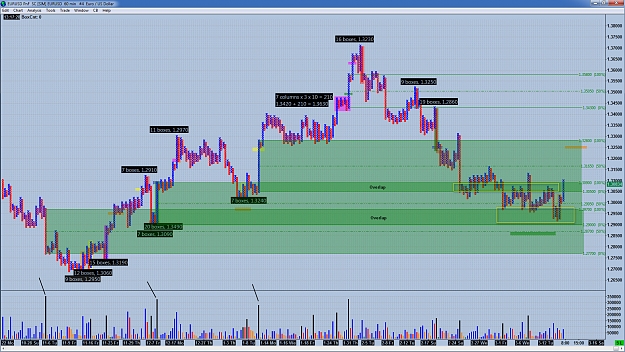
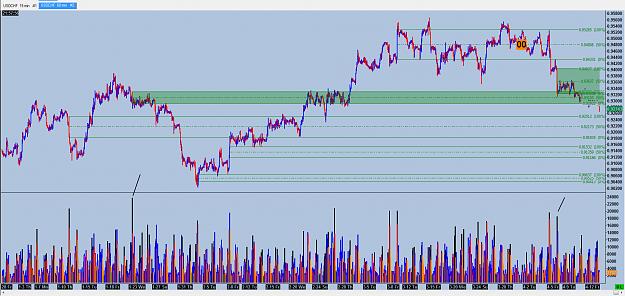
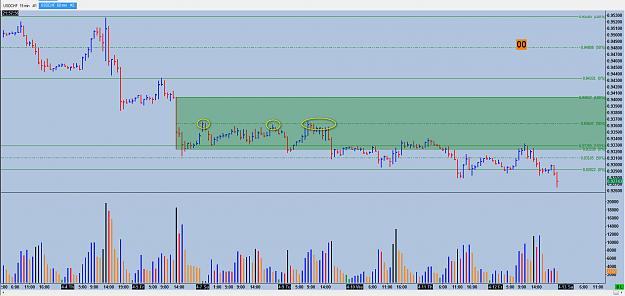
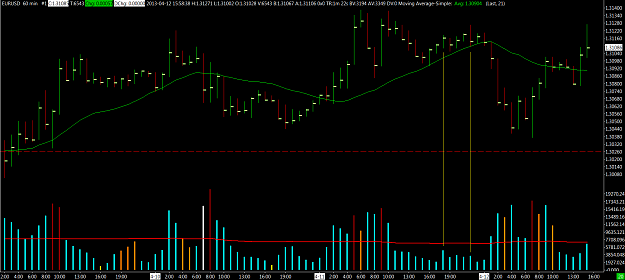
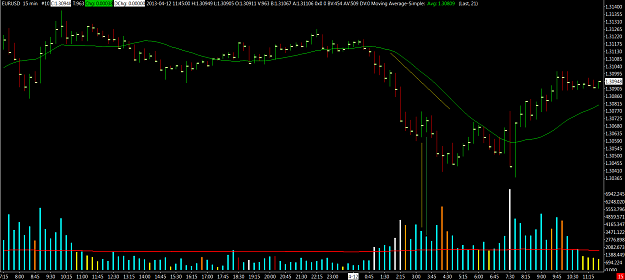
• Home
  • Forums
  • Trades
  • News
  • Calendar
  • Market
  • Brokers
  • Login
  • Join
  • User/Email: Password:
  • 4:14am
Menu
  • Forums
  • Trades
  • News
  • Calendar
  • Market
  • Brokers
  • Login
  • Join
  • 4:14am
Sister Sites
  • Metals Mine
  • Energy EXCH
  • Crypto Craft

Options

Bookmark Thread

First Page First Unread Last Page Last Post

Print Thread

Similar Threads

How to Blow $200 account using VSA--- 594 replies

VSA Journal 57 replies

VSA-divergence trading 186 replies

VSA broker history change datas 11 replies

  • Interactive Trading
  • /
  • Reply to Thread
  • Subscribe

vsa with Malcolm

  • Last Post
  •  
  • 1 11971198Page 119912001201 1688
  • 1 Page 1199 1688
  •  
  • Post #23,961
  • Quote
  • Apr 11, 2013 6:36am Apr 11, 2013 6:36am
  •  KinsaleForex
  • Joined Oct 2010 | Status: Looking at a few more charts... | 1,195 Posts
Quoting joaoborras
Disliked
I just love it! I will put the pictures without commentaries(well, at least not long commentaries...) for your appreciation. It is the audusd today. The news: {image} And the price action(15min chart): {image} Beautiful, isn't it?
Ignored
Look where the up move stopped at the high of the zone and on that retrace it stopped just above the high of another high volume zone. Brilliant!
Attached Image (click to enlarge)
Click to Enlarge

Name: 11-04-2013_AU1hr.jpg
Size: 892 KB
  • Post #23,962
  • Quote
  • Apr 11, 2013 6:43am Apr 11, 2013 6:43am
  •  KinsaleForex
  • Joined Oct 2010 | Status: Looking at a few more charts... | 1,195 Posts
Quoting joaoborras
Disliked
Hi SD, I appreciate your inputs. yes, I acknowledge that I have to resolve some issues about my type of trading. I know I am a day trader, that is for sure. I also know that I want, preferably, find trades every day, because I trade for income. Also, I target 10 to 20 pips per day. I also prefer to trade only few pairs, eurusd, cabel and, maybe, audjpy. I also know that I am a VSA trader, nothing else(when I try to bring things back to the table, it results in s*?t for sure). Now comes the problem. I can find trades in every time frame! If I go...
Ignored
Hi Jo,

Might I recommend you have a look at my Dad's site (in my signature below). You might find some techniques to help you with the patience side of things. It seems to me that you're well able to trade, the next step is focusing that and getting rid of any bad habits that you're aware of. If even to get out of the corporation worker mindset that you mentioned.

A shameless plug for his site, but that ain't gonna stop me

Also, 1000 posts, wooo!
  • Post #23,963
  • Quote
  • Apr 11, 2013 7:45am Apr 11, 2013 7:45am
  •  joaoborras
  • | Joined May 2011 | Status: Member | 263 Posts
Quoting KinsaleForex
Disliked
Hi Jo, Might I recommend you have a look at my Dad's site (in my signature below). You might find some techniques to help you with the patience side of things. It seems to me that you're well able to trade, the next step is focusing that and getting rid of any bad habits that you're aware of. If even to get out of the corporation worker mindset that you mentioned. A shameless plug for his site, but that ain't gonna stop me Also, 1000 posts, wooo!
Ignored
Hi KS, thanks a lot. For sure I will check it out.
At the end, there is a point where it is not the technicals anymore but the self that impedes us to proceed.

Will go to your dad's site.
Again, thanks a lot!

Cheers!
  • Post #23,964
  • Quote
  • Apr 11, 2013 8:07am Apr 11, 2013 8:07am
  •  joaoborras
  • | Joined May 2011 | Status: Member | 263 Posts
Well, eurusd puzzled me today.

According to my post #23958, I was trying to sell this thing when it entered the area that I pointed as bearish change in behavior.
I went to the 1min chart to get an entry. Tried twice and lost both. Total for -19 today.
My readings in the previous post was completely wrong! :-)

Here is the 15min chart with that area detailed:

Attached Image (click to enlarge)
Click to Enlarge

Name: 15min supply area.jpg
Size: 148 KB


And here, the 1min chart with the entries:

Attached Image (click to enlarge)
Click to Enlarge

Name: euro 1min entries.jpg
Size: 207 KB


Cheers!
  • Post #23,965
  • Quote
  • Apr 11, 2013 10:07am Apr 11, 2013 10:07am
  •  abhinkoi
  • | Joined Mar 2011 | Status: Student of markets..explorer of VSA | 81 Posts
Quoting HiddenGap
Disliked
Back to basics: https://www.youtube.com/watch?v=sIza...508601&index=2 {image}
Ignored
Thanks HG. Great video. Thanks for sharing it!
  • Post #23,966
  • Quote
  • Apr 11, 2013 10:08am Apr 11, 2013 10:08am
  •  abhinkoi
  • | Joined Mar 2011 | Status: Student of markets..explorer of VSA | 81 Posts
Quoting joaoborras
Disliked
I'd also like to contribute with a slide made by Richard Kigsdale, from TG. It is the Wyckoff logic sheet. It is attached. It is a good graphic reference for the markets phases, as this on that HG posted to us. Cheers! {image}
Ignored
Thanks Jo. Its really helpful.
  • Post #23,967
  • Quote
  • Apr 11, 2013 1:09pm Apr 11, 2013 1:09pm
  •  HiddenGap
  • Joined Aug 2009 | Status: Reading the tape | 2,231 Posts
Quoting abhinkoi
Disliked
Thanks HG. Great video. Thanks for sharing it!
Ignored
I would recommend all of Lauren's ABCs of VSA series videos. Although she does make some errors. Like a Hidden Up Thrust is not "Hidden" because it does not make a high into new fresh territory. It's "Hidden" because the close is down rather than up.

Unfortunately, I believe one has to join the VSA club to get access to them. Unless of course, one is brave enough to use some of those torrent sites (which I personally am not).
  • Post #23,968
  • Quote
  • Apr 11, 2013 2:01pm Apr 11, 2013 2:01pm
  •  HiddenGap
  • Joined Aug 2009 | Status: Reading the tape | 2,231 Posts
Quoting joaoborras
Disliked
Well, eurusd puzzled me today. According to my post #23958, I was trying to sell this thing when it entered the area that I pointed as bearish change in behavior. I went to the 1min chart to get an entry. Tried twice and lost both. Total for -19 today. My readings in the previous post was completely wrong! :-) Here is the 15min chart with that area detailed: {image} And here, the 1min chart with the entries: {image} Cheers!
Ignored
You and I do not identify our zones the same way, but that does not matter. I too see a key change in the Supply/Demand Dynamic that creates a Supply Zone in the same basic area as you do.

I don't change timeframes in my stlye of trading. But I could see myself looking to take a short after the Up Thrust 3 intervals after Supply coming in. In fact, I might even call that Supply coming in interval a Buying climax. But once I saw the test, I would be very worried. I would have ended up with a loss myself.

I guess my point is... we both suck!

But seriously, I think your thought process was good. You should not blame yourself for having a trading idea and following it thru to plan. Now, if you failed to follow said plan (discipline), that's a different issue altogether.
Attached Image (click to enlarge)
Click to Enlarge

Name: ex 13.png
Size: 207 KB
  • Post #23,969
  • Quote
  • Apr 12, 2013 12:15am Apr 12, 2013 12:15am
  •  joaoborras
  • | Joined May 2011 | Status: Member | 263 Posts
Quoting HiddenGap
Disliked
You and I do not identify our zones the same way, but that does not matter. I too see a key change in the Supply/Demand Dynamic that creates a Supply Zone in the same basic area as you do. I don't change timeframes in my stlye of trading. But I could see myself looking to take a short after the Up Thrust 3 intervals after Supply coming in. In fact, I might even call that Supply coming in interval a Buying climax. But once I saw the test, I would be very worried. I would have ended up with a loss myself. I guess my point is... we both suck! ...
Ignored
HG, thank you!
Today is another day! Let's keep going!

I am aware the way you find your zones, the WRB. I am a student of it as well. I just find that the way the guy wrote his material is quite wordy... :-) But I do have his course as well.
Anyways, maybe another good point from your comment is that you don't change the time frame. That is, indeed, a good idea.
The concept of "time frame" is, in my opinion, a bit flawed. For example, any zone found in big time frames(daily, weekly, etc.) can be detailed to its 15min or even 1min chart. I like to think about "information window" instead of time frame.

I am also a student of Chris Lori, a very, very good educator and forex trader. Very nice guy. He also uses this concepts and he finds, basically, 3 levels where the price is likely to react:
1. the very low/high price of the congestion area
2. the base of the congestion area(we can think it is took from the closes of the candles)
3. the point where the price slept from the area(the wick extreme of the area).

I think that in WRB terms, these are the points used to delineate the gap if the body or the wicks are used(sorry, I don't know if it is precise because it is some time I don't go read the WRB material).

Well, I think this post is a bit confusing. :-)

Cheers!
  • Post #23,970
  • Quote
  • Apr 12, 2013 2:05am Apr 12, 2013 2:05am
  •  Vcv13
  • Joined Feb 2013 | Status: Member | 262 Posts
Quoting KinsaleForex
Disliked
.... There are three huge overlapping volume zones and we have (at the moment) bounced in the area where the two largest zones overlap one another. It was never going to be an easy ride to push down through here.
Ignored

would it be now equally difficult to push UP through those high volume zones? I mean will those zones prove to be resistance zones now for the PA??

the reason I asked this coz I've seen a chart where the PA has pushed down through such HV zones, so will it face resistance now on the way up?

Thanks.

p.s. this was the chart you were referring to

Attached Image (click to enlarge)
Click to Enlarge

Name: 15-03-2013_EU1hrPnF_FF2.jpg
Size: 1.0 MB
The loss was not bad luck. It was bad Analysis - D.Einhorn
  • Post #23,971
  • Quote
  • Apr 12, 2013 5:24am Apr 12, 2013 5:24am
  •  joaoborras
  • | Joined May 2011 | Status: Member | 263 Posts
Quoting joaoborras
Disliked
Well, eurusd puzzled me today. According to my post #23958, I was trying to sell this thing when it entered the area that I pointed as bearish change in behavior. I went to the 1min chart to get an entry. Tried twice and lost both. Total for -19 today. My readings in the previous post was completely wrong! :-) Here is the 15min chart with that area detailed: {image} And here, the 1min chart with the entries: {image} Cheers!
Ignored
Well, levels do matter! :-)
I was short 1 day in advance... haha
  • Post #23,972
  • Quote
  • Apr 12, 2013 7:26am Apr 12, 2013 7:26am
  •  KinsaleForex
  • Joined Oct 2010 | Status: Looking at a few more charts... | 1,195 Posts
Quoting Vcv13
Disliked
would it be now equally difficult to push UP through those high volume zones? I mean will those zones prove to be resistance zones now for the PA?? the reason I asked this coz I've seen a chart where the PA has pushed down through such HV zones, so will it face resistance now on the way up? Thanks. p.s. this was the chart you were referring to {image}
Ignored
Good question and way to put me on the spot

Firstly, let's pick up where the last chart left off. You can see on the original chart I have some orange highlighted areas to the right edge, I thought we may have reached a turning point from the reaction at the overlap area, it turns out I was wrong with this. The target was never reached, in fact the low was taken out on the very next column.

The chart i've uploaded to this post shows the same chart including the data we've had since. (make sure to zoom in, it's a wide image) This starts at point B.

Taking one step back, A(i) shows where I've marked a downside target, this was also in the earlier chart. At point A(ii) you can see this target was hit.

You were asking would these zones then act as resistance to the upside, the low of Zone 3 did exactly this at point C, we came up to the low, almost to the pip and the market reacted sharply to this area proceeding to make new lows.

The low of Zone 1 acted as supported and some strength entered the market here, evident by the largest spike in volume since the high point at the end of January. This generated a long target which was hit. At point D the market came back slightly and the high of Zone 1 acted as support and we moved up further.

The high of Zone 2 and low Zone 3 didn't provide much resistance but on the latest retrace we've stopped right at the low of Zone 3. This could act as support or we could continue pushing through, we'll have to see.

Long story short. I would expect there to be some resistance at these areas if we now proceed upwards. But it's not black and white. A quick move on news like FOMC or NFP can push the market through these zones like they're not even there - which is exactly what news is used for.

We've to look at the potential for these areas to provide support / resistance and trade accordingly with whatever else we can see, be it high volume, testing or no demands etc.

Hope this helps. If i've not been clear please ask more questions!
Attached Image (click to enlarge)
Click to Enlarge

Name: 12-04-2013_EU1hrPnF.jpg
Size: 1.4 MB
  • Post #23,973
  • Quote
  • Apr 13, 2013 2:59am Apr 13, 2013 2:59am
  •  joaoborras
  • | Joined May 2011 | Status: Member | 263 Posts
Here is a view on COT charts.

Sterling is positioned for a move up:

Attached Image (click to enlarge)
Click to Enlarge

Name: 6B COT data 2013413.jpg
Size: 152 KB


Euro, down:

Attached Image (click to enlarge)
Click to Enlarge

Name: 6E COT data 2013413.jpg
Size: 135 KB


US dollar is not that clear but seems that at least a pull back, maybe to the 80ish, is due:

Attached Image (click to enlarge)
Click to Enlarge

Name: DX COT data 2013413.jpg
Size: 149 KB


COT data is very good for long term view, takes time to realize in the markets movements. For day traders is almost irrelevant but is good to have this image. Fore example, if we know that US dollar is due for a pull back(weak) and sterling is due to up move(strong), a good idea is to favor longs on demand zones.

Have a nice weekend!
  • Post #23,974
  • Quote
  • Apr 13, 2013 9:04am Apr 13, 2013 9:04am
  •  KinsaleForex
  • Joined Oct 2010 | Status: Looking at a few more charts... | 1,195 Posts
There's more info on my blog but I just wanted to post a couple of charts here as well. Highlighting my Swissy short for the week. Loosely ties in with my last post about previous zones.

The first chart shows an old zone from the end of January that provided support throughout the week and stopped my short gaining any momentum.

The second chart highlights the resistance at the 50% of the highlighted zone, these three points coincide with the resistance at the zone low on the PnF chart. Nice how it all tied together.

I took the triple falling bottom in the yellow rectangle on the PnF chart. I was holding the trade from Tuesday but decided to close on Friday evening as I don't like holding them over the weekend.
Attached Images (click to enlarge)
Click to Enlarge

Name: 13-04-2013_UC1hrHLC(i).jpg
Size: 511 KB Click to Enlarge

Name: 13-04-2013_UC1hrHLC(ii).jpg
Size: 327 KB Click to Enlarge

Name: 13-04-2013_UC1hrPnF.jpg
Size: 894 KB
  • Post #23,975
  • Quote
  • Apr 13, 2013 9:05am Apr 13, 2013 9:05am
  •  Vcv13
  • Joined Feb 2013 | Status: Member | 262 Posts
Quoting KinsaleForex
Disliked
You were asking would these zones then act as resistance to the upside, the low of Zone 3 did exactly this at point C, we came up to the low, almost to the pip and the market reacted sharply to this area proceeding to make new lows. The low of Zone 1 acted as supported and some strength entered the market here, evident by the largest spike in volume since the high point at the end of January. This generated a long target which was hit. At point D the market came back slightly and the high of Zone 1 acted as support and we moved up further. The high...
Ignored
thanks bro, happy to learn something here.
The loss was not bad luck. It was bad Analysis - D.Einhorn
  • Post #23,976
  • Quote
  • Apr 13, 2013 7:51pm Apr 13, 2013 7:51pm
  •  Jasus
  • | Joined Jun 2010 | Status: Portuguese Escudo Trader | 303 Posts
Quoting joaoborras
Disliked
Here is a view on COT charts. Sterling is positioned for a move up: {image} Euro, down: {image} US dollar is not that clear but seems that at least a pull back, maybe to the 80ish, is due: {image} COT data is very good for long term view, takes time to realize in the markets movements. For day traders is almost irrelevant but is good to have this image. Fore example, if we know that US dollar is due for a pull back(weak) and sterling is due to up move(strong), a good idea is to favor longs on demand zones. Have a nice weekend!
Ignored
Hey Joao (portuguese compatriot I'm guessing? ), I'm not very familiar with using COT report, can you explain how do you use the positions of commercials and large speculators to your analysis? Are the commercials the corporations who use futures to buy/sell commodities and hedgers? And does the smart money make a up a big part of the large speculators or not?
  • Post #23,977
  • Quote
  • Apr 13, 2013 11:15pm Apr 13, 2013 11:15pm
  •  SimpleDev
  • Joined Apr 2010 | Status: Retired | 575 Posts
Quoting joaoborras
Disliked
Well, eurusd puzzled me today. According to my post #23958, I was trying to sell this thing when it entered the area that I pointed as bearish change in behavior. I went to the 1min chart to get an entry. Tried twice and lost both. Total for -19 today. My readings in the previous post was completely wrong! :-) Here is the 15min chart with that area detailed: {image} And here, the 1min chart with the entries: {image} Cheers!
Ignored
hmm been thinking about this.. Like you said, you only want 10-20 pips out of the market.

Try working on following what Asia does and as well trading with the 15m trend.

Thursday I did not see it at the time, but there is subtle buying on the 30 min chart in the dip at Asia open, and after all EU has been in an up trend for a few days, so it shouldn't take much to move EU upwards.

Zooming in on the 15m chart, even though PA does show some weakness where you shorted it, it was against the trend, in which if Asia bought it would only make sense the would be prepared to defend it and take it upwards.

I still advocate to wait for volume that reaches out and slaps you across the face, but I am just thinking out loud I suppose.

So recap, figure out what Asia did.. don't fight the 15m trend.
Attached Images (click to enlarge)
Click to Enlarge

Name: 30m.png
Size: 62 KB Click to Enlarge

Name: 15m.png
Size: 46 KB
  • Post #23,978
  • Quote
  • Apr 13, 2013 11:19pm Apr 13, 2013 11:19pm
  •  SimpleDev
  • Joined Apr 2010 | Status: Retired | 575 Posts
Quoting KinsaleForex
Disliked
There's more info on my blog but I just wanted to post a couple of charts here as well. Highlighting my Swissy short for the week. Loosely ties in with my last post about previous zones. The first chart shows an old zone from the end of January that provided support throughout the week and stopped my short gaining any momentum. The second chart highlights the resistance at the 50% of the highlighted zone, these three points coincide with the resistance at the zone low on the PnF chart. Nice how it all tied together. I took the triple falling...
Ignored
Nice.. Your PnF is really bringing everything together for you.

Excellent short!
  • Post #23,979
  • Quote
  • Apr 13, 2013 11:33pm Apr 13, 2013 11:33pm
  •  SimpleDev
  • Joined Apr 2010 | Status: Retired | 575 Posts
Quoting SimpleDev
Disliked
So recap, figure out what Asia did.. don't fight the 15m trend. {image} {image}
Ignored
Here is Friday.

1st chart is a 1h, with the first bar marked would be Asia open.

2nd chart showing 15m trend.
Attached Images (click to enlarge)
Click to Enlarge

Name: 1h.png
Size: 61 KB Click to Enlarge

Name: 15m.png
Size: 58 KB
  • Post #23,980
  • Quote
  • Apr 14, 2013 2:39am Apr 14, 2013 2:39am
  •  joaoborras
  • | Joined May 2011 | Status: Member | 263 Posts
Quoting SimpleDev
Disliked
hmm been thinking about this.. Like you said, you only want 10-20 pips out of the market. Try working on following what Asia does and as well trading with the 15m trend. Thursday I did not see it at the time, but there is subtle buying on the 30 min chart in the dip at Asia open, and after all EU has been in an up trend for a few days, so it shouldn't take much to move EU upwards. Zooming in on the 15m chart, even though PA does show some weakness where you shorted it, it was against the trend, in which if Asia bought it would only make sense the...
Ignored
Hi SD!
Thanks a lot to take your time to think about it. I appreciate that.
And it is really good advice. I will incorporate it in my trading.

Again, thank you very much.
  • Interactive Trading
  • /
  • vsa with Malcolm
  • Reply to Thread
    • 1 11971198Page 119912001201 1688
    • 1 Page 1199 1688
1 member viewing:
KingofRats
  • More
Top of Page
  • Facebook
  • Twitter
About FF
  • Mission
  • Products
  • User Guide
  • Media Kit
  • Blog
  • Contact
FF Products
  • Forums
  • Trades
  • Calendar
  • News
  • Market
  • Brokers
  • Trade Explorer
FF Website
  • Homepage
  • Search
  • Members
  • Report a Bug
Follow FF
  • Facebook
  • Twitter

FF Sister Sites:

  • Metals Mine
  • Energy EXCH
  • Crypto Craft

Forex Factory® is a brand of Fair Economy, Inc.

Terms of Service / ©2021