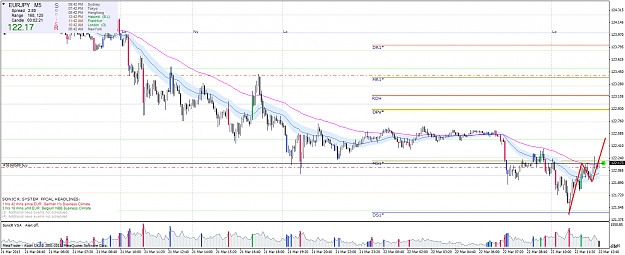
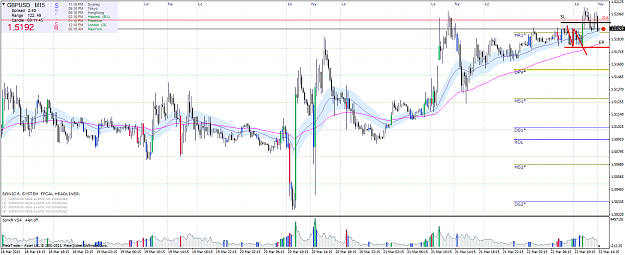
Disliked1. This I think is DR1 and DS1 and so on are Daily Resistance level 1, 2, 3 and Daily Support 1, 2, 3, not sure about MR. RWL RWH are Recent Weekly Low and High. RDH and RDL are recent Dayily high and low.
2. That dot is green when price is rising and red when falling. It's visual help I guess.
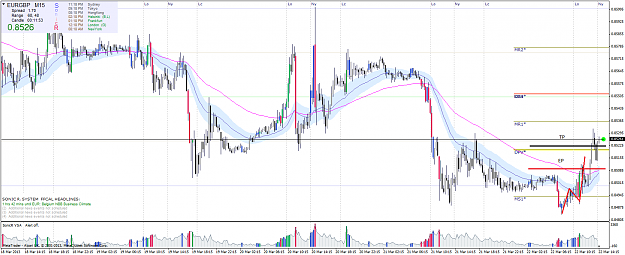
3. Your using outdated template. Follow link on post #1 to Professor TAHs templates.
4. This is improved volume indicator from Professor TAH.Ignored
I am using this template "Sonic R By GuruKris.rar " in post 1 and setup the tah template inside. Is that right or is there another one?
Thanks!
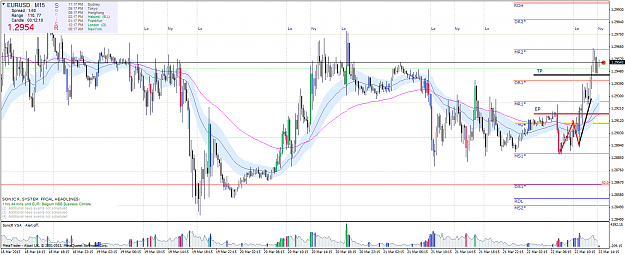
Is there a post somewhere that shows how to use the tah system? as in a manual for it because the indicators are abit different?