• Home
  • Forums
  • Trades
  • News
  • Calendar
  • Market
  • Brokers
  • Login
  • Join
  • User/Email: Password:
  • 11:39am
Menu
  • Forums
  • Trades
  • News
  • Calendar
  • Market
  • Brokers
  • Login
  • Join
  • 11:39am
Sister Sites
  • Metals Mine
  • Energy EXCH
  • Crypto Craft

Options

Bookmark Thread

First Page First Unread Last Page Last Post

Printable Version

Similar Threads

Trading Made Simple 117,487 replies

Trading Made Simple the right way, and other trading lessons 233 replies

Indicators for the 'Trading Made Simple' system 339 replies

Charts, Charts, Charts! 1 reply

Trading Made Simple Charts Journal 2 replies

  • Trading Systems
  • /
  • Reply to Thread
  • Subscribe
  • 1,484
Attachments: Trading Made Simple for Day Charts
Exit Attachments

Trading Made Simple for Day Charts

  • Last Post
  •  
  • 1 6263Page 646566 132
  • 1 Page 64 132
  •  
  • Post #1,261
  • Quote
  • Feb 7, 2013 6:07pm Feb 7, 2013 6:07pm
  •  kingclarence
  • | Joined Oct 2011 | Status: Member | 191 Posts
Quoting Britpip7
Disliked
I like Oz trader - Niall Fuller's approach - no clutter and lots of info on his web site, even if you don't subscribe. I check in on his site occasionally and it is always worth reading the articles. He generally advocates forecasting how far the price can move and looking for a risk / reward ratio of 1:3, so hi s SL settings are usually not too painful, although I cannot speak to how often they get hit.

I am still sticking to the ATR 7 set ups / swing high/low for SL and this means really nailing your trading plan for your entry criteria -...
Ignored
Yeah his site is good.Also went back and looked through some of my books and some other sites.A couple of things that i re remembered that i read was the fact that even if you only have one indicator if you study it enough you can learn to be profitable.Also the part about being unemotional about wins and losses.

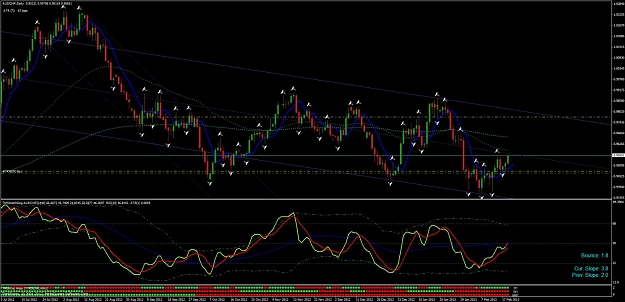
Thats why all i got is the heiken ash candles and the TDI.Eventually im gonna remove those two indicators as well.Also once i get the day charts down pretty good im probably gonna move up to the weekly charts.The key right now for me is to ride my trades all the way out.Im playing to win not to not lose
  • Post #1,262
  • Quote
  • Feb 9, 2013 1:06am Feb 9, 2013 1:06am
  •  Britpip7
  • Joined Apr 2011 | Status: "Never Give Up - Never Surrender" | 1,608 Posts
Trade summary for the week is 1 loss (thanks to the NZD unemployment news) and 2 wins.

EUR NZD Loss 2 X 125 pips for -250pips

GBP NZD Win - TP1 for 100pips, TP2 for 95pips for a total of 195pips

GBP CHF win - TP1 for 75pips, TP2 for 135pips and AOC 1 for 34 pips for a total of 244pips

Net for the week = 189pips
Attached Images (click to enlarge)
Click to Enlarge

Name: eur nzd loss.gif
Size: 44 KB Click to Enlarge

Name: gbp nzd win.gif
Size: 45 KB Click to Enlarge

Name: gbp chf win 1.gif
Size: 41 KB Click to Enlarge

Name: gbp chf win h4.gif
Size: 46 KB
"To live with Passion, it takes Courage and Grace to survive"
  • Post #1,263
  • Quote
  • Feb 9, 2013 12:20pm Feb 9, 2013 12:20pm
  •  Britpip7
  • Joined Apr 2011 | Status: "Never Give Up - Never Surrender" | 1,608 Posts
Quoting Britpip7
Disliked
Trade summary for the week is 1 loss (thanks to the NZD unemployment news) and 2 wins.

EUR NZD Loss 2 X 125 pips for -250pips

GBP NZD Win - TP1 for 100pips, TP2 for 95pips for a total of 195pips

GBP CHF win - TP1 for 75pips, TP2 for 135pips and AOC 1 for 34 pips for a total of 244pips

Net for the week = 189pips
Ignored
Interesting to see the stats on the # of hits on the charts I posted last night - the loss chart is getting a lot more attention than the win charts!

Post some comments / critiques on the charts - especially the loss
"To live with Passion, it takes Courage and Grace to survive"
  • Post #1,264
  • Quote
  • Feb 9, 2013 8:01pm Feb 9, 2013 8:01pm
  •  Britpip7
  • Joined Apr 2011 | Status: "Never Give Up - Never Surrender" | 1,608 Posts
One of the TDI patterns that gives really good reversals is when the RSI Price Line & Trade Signal Lines pull away from the Mid Zone Line and especially when this occurs in the Overbought / Oversold areas.

Combine this with a Supply / Demand Zone and the PA moves can be quite dramatic.
Attached Image (click to enlarge)
Click to Enlarge

Name: tdi pattern and cross.gif
Size: 40 KB
"To live with Passion, it takes Courage and Grace to survive"
  • Post #1,265
  • Quote
  • Feb 9, 2013 8:42pm Feb 9, 2013 8:42pm
  •  Britpip7
  • Joined Apr 2011 | Status: "Never Give Up - Never Surrender" | 1,608 Posts
Round up for the coming week's watch list:

GU - currently closing beneath the latest supply zone, so could resume down - current trend is down - also strong S/R levels historically may prevent any sustained push higher

AU - Large reversal candle may precede an APB colour change - TDI oversold

AUD/JPY showing bearish divergence on TDI

Generally JPY pairs showing reversals - watch on H4 for breaks of zones

EUR/JPY H4 now in a zone, watch for breaks either way

Eur AUD although technically stil in an up trend, recent sideways PA and a recent Fractal Low may be a clue

GBP AUD PA moving away from Demand Zone - waiting to see if there is a close above 200EMA

AUD CHF Recent patterns would suggest that the support levels will hold - watch for PA heading north
Attached Images (click to enlarge)
Click to Enlarge

Name: gbp usd day 2-9-2013.gif
Size: 39 KB Click to Enlarge

Name: aud usd day 2-9-2013.gif
Size: 40 KB Click to Enlarge

Name: aud jpy day 2-9-2013 bearish diverance.gif
Size: 34 KB Click to Enlarge

Name: eur jpy h4 s&d zones.gif
Size: 38 KB
Click to Enlarge

Name: eur aud day 2-9-2013.gif
Size: 36 KB Click to Enlarge

Name: gbp aud day 2-9-2013.gif
Size: 36 KB Click to Enlarge

Name: aud chf day 2-9-2013.gif
Size: 46 KB
"To live with Passion, it takes Courage and Grace to survive"
  • Post #1,266
  • Quote
  • Feb 10, 2013 3:59pm Feb 10, 2013 3:59pm
  •  kingclarence
  • | Joined Oct 2011 | Status: Member | 191 Posts
Quoting Britpip7
Disliked
One of the TDI patterns that gives really good reversals is when the RSI Price Line & Trade Signal Lines pull away from the Mid Zone Line and especially when this occurs in the Overbought / Oversold areas.

Combine this with a Supply / Demand Zone and the PA moves can be quite dramatic.
Ignored
Yup also when the yellow line goes above or below overbought oversold and makes a sharp V point.This is usually money
  • Post #1,267
  • Quote
  • Edited at 10:19pm Feb 10, 2013 10:03pm | Edited at 10:19pm
  •  Britpip7
  • Joined Apr 2011 | Status: "Never Give Up - Never Surrender" | 1,608 Posts
Some thoughts on APB Colour Changes and what to look for with regard mostly to reversals but can also apply after a consolidation period followed by a trend continuation.

Guidelines Summary.

1. Wait for day candle to close

2. Confirm Colour Change - set entries slightly above candle high for longs, below candle low for shorts

3. Best colour change candles have wicks top and bottom - usually top and bottom wicks will be similar in value, although not essential - also, they will have more body than wicks, again not essential

4. Colour change candle value (ATR 1) should be at least 75% of the previous candle ATR 7

5. Colour change candles that are > 2X of the ATR7 may result in a PA stall - can still be valid entries, but may not produce +ve results straight away

6. TDI crosses that coincide with a colour change candle are great, especially if the TDI is in Overbought / Oversold territory

7. Watch for candle reversal patterns preceding a colour change such as doji / hammer / shooting star / inside candle / engulfing candle - these all improve yor success probability

8. Colour change candles closing and moving away from a Supply / Demand Zone are also really strong indicators

Look for these patterns when backtesting and verify what patterns work best for your trading plan / style.

Standard entry rules apply - use the colour change candle ATR 7 - set TP1 to 1 X ATR 7 - SL can be Swing high / low or 1.5 to 2 X ATR 7. Set TP2 with the same SL and leave TP open - move to BE when TP1 is hit and then change to H4 and manage SL manually and look for H4 Add-Ons on Fractal Breaks.

This has been added as a reference post to Post #1
Attached Images (click to enlarge)
Click to Enlarge

Name: apb colour change guidelines.gif
Size: 55 KB Click to Enlarge

Name: apb colour change guidelines 2.gif
Size: 41 KB Click to Enlarge

Name: apb colour change guidelines 3.gif
Size: 41 KB Click to Enlarge

Name: apb colour change guidelines 4.gif
Size: 43 KB
"To live with Passion, it takes Courage and Grace to survive"
  • Post #1,268
  • Quote
  • Feb 11, 2013 7:19am Feb 11, 2013 7:19am
  •  AlbinaGrande
  • | Joined Feb 2012 | Status: Member | 256 Posts
Hi David, Thanks so much for this great Summary. The examples are excellent. Bob
Do not dwell in the past, do not dream of the future, concentrate the mind.
  • Post #1,269
  • Quote
  • Feb 11, 2013 1:50pm Feb 11, 2013 1:50pm
  •  HxMark
  • | Joined Oct 2010 | Status: Member | 30 Posts
I agree. Thanks for posting the charts. I'm new to the thread and find your charts very helpful.
  • Post #1,270
  • Quote
  • Feb 11, 2013 9:18pm Feb 11, 2013 9:18pm
  •  echoman_1
  • | Joined Dec 2012 | Status: Member | 16 Posts
Thanks so much for the lessons again Britpip.
  • Post #1,271
  • Quote
  • Feb 12, 2013 11:28pm Feb 12, 2013 11:28pm
  •  Britpip7
  • Joined Apr 2011 | Status: "Never Give Up - Never Surrender" | 1,608 Posts
Hi Folks,

thanks for the feedback on the charts - much appreciated.
"To live with Passion, it takes Courage and Grace to survive"
  • Post #1,272
  • Quote
  • Feb 13, 2013 4:38pm Feb 13, 2013 4:38pm
  •  wickstedFX
  • | Joined Nov 2009 | Status: Member | 89 Posts
Hi David

Really apprecaite your updates and charts. Can you please explain how your re enter or add to a trade?

Thanks
Tim
  • Post #1,273
  • Quote
  • Feb 14, 2013 9:46am Feb 14, 2013 9:46am
  •  Verbal
  • | Joined Nov 2011 | Status: Member | 107 Posts
Loser Add-On trade. I guess it was the news from Germany and France.
Attached Image (click to enlarge)
Click to Enlarge

Name: eu-4h.gif
Size: 11 KB
  • Post #1,274
  • Quote
  • Edited at 4:05pm Feb 14, 2013 3:36pm | Edited at 4:05pm
  •  Britpip7
  • Joined Apr 2011 | Status: "Never Give Up - Never Surrender" | 1,608 Posts
Quoting wickstedFX
Disliked
Hi David

Really apprecaite your updates and charts. Can you please explain how your re enter or add to a trade?

Thanks
Tim
Ignored
Hi Tim,

There are a bunch of training charts in the attachments on this. Here are a few of them - look for "training" "Add-On"

http://www.forexfactory.com/showthre...20#post5931520

http://www.forexfactory.com/showthre...70#post6074770

http://www.forexfactory.com/showthre...76#post6395176

http://www.forexfactory.com/showthre...40#post6340740

Basic overview, switch to H4 and stay with the current day trend, look for Fractals and when the price breaks the Fractal, that is your entry signal. Verify you are not trading into a support / resistance area or a supp / demand zone.
"To live with Passion, it takes Courage and Grace to survive"
  • Post #1,275
  • Quote
  • Feb 14, 2013 3:43pm Feb 14, 2013 3:43pm
  •  Britpip7
  • Joined Apr 2011 | Status: "Never Give Up - Never Surrender" | 1,608 Posts
Quoting Verbal
Disliked
Loser Add-On trade. I guess it was the news from Germany and France.
Ignored
mmmm....

That was an unfortunate hit after a very nice colour change on APB on the day and a nice candle reversal pattern - sometimes news can take out even a good set-up.

The only thing that would have made the set-up stronger would have been a confirmed Day chart TDI cross at the close of the Colour change bar.
Attached Image (click to enlarge)
Click to Enlarge

Name: eu day 2-14-2013.gif
Size: 37 KB
"To live with Passion, it takes Courage and Grace to survive"
  • Post #1,276
  • Quote
  • Feb 14, 2013 5:59pm Feb 14, 2013 5:59pm
  •  HxMark
  • | Joined Oct 2010 | Status: Member | 30 Posts
Is there an indicator that shows the atr value of previous candles or do you calculate this manually?

Thanks

Mark
  • Post #1,277
  • Quote
  • Feb 14, 2013 6:13pm Feb 14, 2013 6:13pm
  •  Britpip7
  • Joined Apr 2011 | Status: "Never Give Up - Never Surrender" | 1,608 Posts
Quoting HxMark
Disliked
Is there an indicator that shows the atr value of previous candles or do you calculate this manually?

Thanks

Mark
Ignored
Mark,

Here's the screenshot with the indicators - you will need the ATR Pips UL Corner - period 1, multiplier 1 - Visualization - show in data window

Place your cursor on the candle and the ATR 1 will display in the data window
Attached Image (click to enlarge)
Click to Enlarge

Name: britpip7 screenshot indicators.gif
Size: 64 KB
"To live with Passion, it takes Courage and Grace to survive"
  • Post #1,278
  • Quote
  • Feb 14, 2013 7:18pm Feb 14, 2013 7:18pm
  •  Britpip7
  • Joined Apr 2011 | Status: "Never Give Up - Never Surrender" | 1,608 Posts
Not much trading this week due to work commitments, so I have missed every set.

Of note was this one - GBP AUD. Waiting to see if a new Demand Zone is established and then watch for reversal options. If a Zone does not form, possible H4 entry for a continuation
Attached Image (click to enlarge)
Click to Enlarge

Name: gbp aud day 2-14-2013.gif
Size: 41 KB
"To live with Passion, it takes Courage and Grace to survive"
  • Post #1,279
  • Quote
  • Feb 16, 2013 9:54pm Feb 16, 2013 9:54pm
  •  Britpip7
  • Joined Apr 2011 | Status: "Never Give Up - Never Surrender" | 1,608 Posts
Following my week off testing strategies on the H1, back to the reality of day charts and the upcoming watch list. I' be trading H1 and posting results on X Man's thread, so leaving this thread clean for the Day charts, etc.

Lots of EURO news at the end of the week that put a halt to some of the recent moves as well as the GBP attempting to throw off the ddom and gloom talking heads.

EU = price stalling above the 1.3300 marker - currently sitting above a Demand Zone, so watching for a bull candle following Fridays doji which has created a double bottom

GU showing signs of another pause as it continues its drop - possible chance of a pull back from the Demand Zone to the 38.2 if it clears 23.6

AU & NU - still too choppy on the day - maybe possible for entries on the H4 - follow the general Day trend

JPY pairs are mostly range bound but with several hundred pips of range, so again look for entries on H4 within the ranges - most pairs are sitting on mid Zones right now - UJ shown for day and h4 to give you an idea of the zones

EUR/AUD is sitting on the 100/200EMA - wait for move and close away from this level

GBP / AUD looking for a bounce away from the Demand Zone GBP / NZD similar pattern

GBP / CHF possible retrace to the 38.2 level

EUR / GBP if it breaks the previous Fractal Low @ 8445 then we could have a longer retrace / full reversal
Attached Images (click to enlarge)
Click to Enlarge

Name: eu 2-16-2013 day.gif
Size: 34 KB Click to Enlarge

Name: gu 2-16-2013 day.gif
Size: 34 KB Click to Enlarge

Name: uj 2-16-2013 day.gif
Size: 31 KB Click to Enlarge

Name: uj 2-16-2013 h4.gif
Size: 37 KB
Click to Enlarge

Name: gbp aud 2-16-2013 day.gif
Size: 35 KB Click to Enlarge

Name: gbp chf 2-16-2013 day.gif
Size: 36 KB Click to Enlarge

Name: eur gbp 2-16-2013 day.gif
Size: 34 KB
"To live with Passion, it takes Courage and Grace to survive"
  • Post #1,280
  • Quote
  • Feb 19, 2013 2:54pm Feb 19, 2013 2:54pm
  •  Buttonjock
  • | Joined Oct 2012 | Status: Member | 167 Posts
Hello folks, I'm back :o)

Had an enforced absence due to rain. It came down for three days and our home developed a couple of small leaks. This was not of itself a problem, except that one of them was right on top of my PC. Power supply blew out but fortunately no other damage, just the wait time for it to get fixed. Been using a old back up PC and had forgotten my log in password.

Anyway, demo trading in December and January gave me a 30/12 win/loss ratio over 42 trades, with 2000+ pips profit, so February was time to go live. So far the only really bad trade was the same eurusd that Verbal got caught on. Other than that I have two small losses; tried get clever on the 1hr chart with the eur/chf, which was very silly, for a small loss and just closed an audjpy that's been going nowhere and just making me uncomfortable.

One trade live at the moment on the audchf, diong nicely
Attached Image (click to enlarge)
Click to Enlarge

Name: audchf.jpg
Size: 131 KB
  • Trading Systems
  • /
  • Trading Made Simple for Day Charts
  • Reply to Thread
    • 1 6263Page 646566 132
    • 1 Page 64 132
0 traders viewing now
  • More
Top of Page
  • Facebook
  • Twitter
About FF
  • Mission
  • Products
  • User Guide
  • Media Kit
  • Blog
  • Contact
FF Products
  • Forums
  • Trades
  • Calendar
  • News
  • Market
  • Brokers
  • Trade Explorer
FF Website
  • Homepage
  • Search
  • Members
  • Report a Bug
Follow FF
  • Facebook
  • Twitter

FF Sister Sites:

  • Metals Mine
  • Energy EXCH
  • Crypto Craft

Forex Factory® is a brand of Fair Economy, Inc.

Terms of Service / ©2021